Hi Guys,
I'm trying to do something that is fairly complex (at least for me anyways). I'm trying to create a function that will do the following:
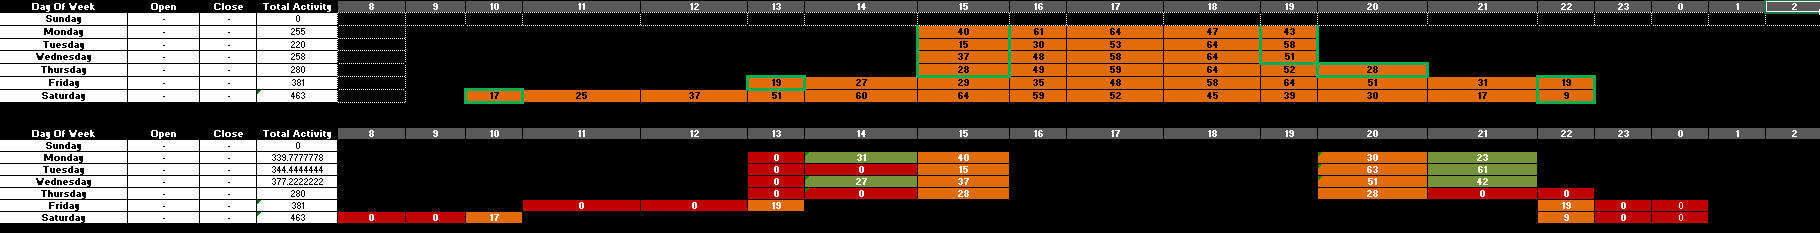
1) Look at each day of the week. If no cell in the day is > 0, the business is closed no that particular day, and the formula should return "Closed"
2) For days that a business is open, the first and last value in the array is transferred to a corresponding cell in another data set below the primary data set (see image for example). This may also be the point to gather the 2 values immediately after the first value and 2 values immediately before the last value.
3) The purpose of gathering the 3 values at the beginning & end of the data set is to forecast the 2 "0" values immediately before the first value in the row that is > 0 and the 2 values immediately after the last number in the data set > 0.
4) The values that are transferred to the lower data set must meet certain criteria. They must be higher than a specific threshold to transfer. For this example I used 20. I used a simple IF statement coupled w/ the FORECAST function to determine the values I was looking for, which brought up another question. Is there a way to just return the value of the test function rather than inserting the same equation twice...once for the test, and immediately followed by what happens if the equation is true? Here's my formula:
=IF((FORECAST($K$13,L18:N18,$L$13:N13)>20),FORECAST($K$13,L18:N18,$L$13:N13),0) - wasn't sure if there was a way to drop the 2nd "FORECAST($K$13,L16:N16,L13:$N$13)"?
5) The last step is to add the plotted forecast values to a chart that already has all the primary dataset figures in it, and add a different styled line to show the forecast figures.
Anyone that can lend a hand...I owe ya one!!! Thanks in advance for any help!
To provide a clearer understanding of what I'm trying to accomplish, this would be an example of what the finished product would look like:
I'm trying to do something that is fairly complex (at least for me anyways). I'm trying to create a function that will do the following:
1) Look at each day of the week. If no cell in the day is > 0, the business is closed no that particular day, and the formula should return "Closed"
2) For days that a business is open, the first and last value in the array is transferred to a corresponding cell in another data set below the primary data set (see image for example). This may also be the point to gather the 2 values immediately after the first value and 2 values immediately before the last value.
3) The purpose of gathering the 3 values at the beginning & end of the data set is to forecast the 2 "0" values immediately before the first value in the row that is > 0 and the 2 values immediately after the last number in the data set > 0.
4) The values that are transferred to the lower data set must meet certain criteria. They must be higher than a specific threshold to transfer. For this example I used 20. I used a simple IF statement coupled w/ the FORECAST function to determine the values I was looking for, which brought up another question. Is there a way to just return the value of the test function rather than inserting the same equation twice...once for the test, and immediately followed by what happens if the equation is true? Here's my formula:
=IF((FORECAST($K$13,L18:N18,$L$13:N13)>20),FORECAST($K$13,L18:N18,$L$13:N13),0) - wasn't sure if there was a way to drop the 2nd "FORECAST($K$13,L16:N16,L13:$N$13)"?
5) The last step is to add the plotted forecast values to a chart that already has all the primary dataset figures in it, and add a different styled line to show the forecast figures.
Anyone that can lend a hand...I owe ya one!!! Thanks in advance for any help!
To provide a clearer understanding of what I'm trying to accomplish, this would be an example of what the finished product would look like:


