Area Chart Help - Negative & Positive Values

meredithtaylor

New Member
Joined
Jul 13, 2022
Messages
4
Office Version
  1. 2010
Platform
  1. Windows
Hello,

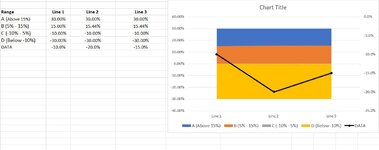
I'm trying to create an area graph to shade each range percentage listed in the far left column (pictured) a different color.
  • Rage A - shade anything above 15% one color
  • Range B - shade 5 - 15% a different color
  • Range C - shade -10 - 5% a different color
  • Range D - shade anything below -10% a different color
I'm having issues with range C, for some reason it is not wanting to shade both a positive and negative region. Range C is not showing up on the graph at all.

I have included an image for reference. The goal of this chart is to show where the "Data" (the black line line on the graph) falls in the A,B,C & D ranges.

Any help is appreciated! Thanks!
 

Attachments

  • Excel.JPG
    Excel.JPG
    85.4 KB · Views: 11

Excel Facts

Excel Wisdom
Using a mouse in Excel is the work equivalent of wearing a lanyard when you first get to college
Hi and welcome...

Should it look something like this?
Screenshot 2022-07-14 101726.png
 
Upvote 0
Hi and welcome...

Should it look something like this?View attachment 69257
Hello,

I'd like my graph to look exactly like the graph I pictured below. I need the A, B, C & D ranges to be filled in for the below percentages.

  • Rage A - shade anything above 15%
  • Range B - shade 5 - 15%
  • Range C - shade -10 - 5%
  • Range D - shade anything below -10%
I need the A, B, C & D ranges to be the exact same across lines 1, 2, & 3

I also need a separate "DATA" line that is a line graph that plots the below percentages across lines 1-3.
Line 1 : -10%
Line 2: -20%
Line 3: -15%

What does my initial data chart need to look like to replicate this graph? I had to photoshop range "C" in the below image because I was not able to get the area to fill both negative & positive percentages (-10% - 5%).
Excel Graph.JPG
 
Upvote 0
Will have another look... Your original Range D color was over Range C ( so basically the fill color for C was hidden behind D) that is why with my suggestion I made the fill color of D no fill and just gave it a border so one can see Range C color... Will investigate another approach. .
 
Upvote 0
Will have another look... Your original Range D color was over Range C ( so basically the fill color for C was hidden behind D) that is why with my suggestion I made the fill color of D no fill and just gave it a border so one can see Range C color... Will investigate another approach. .
Thank you, I appreciate the help!
 
Upvote 0
Thank you, I appreciate the help!

Hi Meredith

I have been trying to do this and below is the closest I am getting. the issue with the area chart and your data set is that the colors keep overlapping which causes one to be behind the other. One cannot separate them as with lets say gap width and series overlap as with a column chart. What I ended dup doing was play around with the colors a bit and then setting the fill color for Range D to 50% transparency. Other than this not sure how to accomplish it. maybe someone else has a suggestion?

Screenshot 2022-07-14 191324.png
 
Upvote 0

Forum statistics

Threads
1,215,066
Messages
6,122,948
Members
449,095
Latest member
nmaske

We've detected that you are using an adblocker.

We have a great community of people providing Excel help here, but the hosting costs are enormous. You can help keep this site running by allowing ads on MrExcel.com.
Allow Ads at MrExcel

Which adblocker are you using?

Disable AdBlock

Follow these easy steps to disable AdBlock

1)Click on the icon in the browser’s toolbar.
2)Click on the icon in the browser’s toolbar.
2)Click on the "Pause on this site" option.
Go back

Disable AdBlock Plus

Follow these easy steps to disable AdBlock Plus

1)Click on the icon in the browser’s toolbar.
2)Click on the toggle to disable it for "mrexcel.com".
Go back

Disable uBlock Origin

Follow these easy steps to disable uBlock Origin

1)Click on the icon in the browser’s toolbar.
2)Click on the "Power" button.
3)Click on the "Refresh" button.
Go back

Disable uBlock

Follow these easy steps to disable uBlock

1)Click on the icon in the browser’s toolbar.
2)Click on the "Power" button.
3)Click on the "Refresh" button.
Go back
Back
Top