I think this is more of a math question that an excel question, but maybe someone can help me see the light. I am trying to calculate the average for each widget per customer per year. So, think of it like this. I have a business where I sell widgets. I would like to calculate for a mythical customer in a given year how much that customer would spend on each widget. So I need to calculate for each widget the average cost per customer per year. Then I could add up the costs and figure out what an average customer would spend in an average year for each widget. Sound simple?
Here I have a screenshot of how I tried to do this (unsuccessfully, I should add)
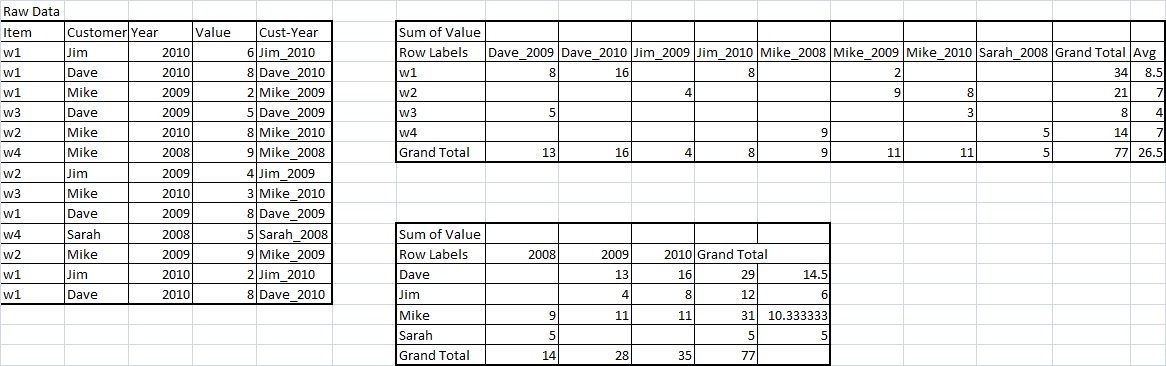
I have recorded the Item, Customer Name, Year and Value. I created the Cust-Year column to help with the first pivot table. I calculate the average for each row in the pivot table. And when I total the average for each widget, I get 26.5, and you can see the values for each individual widget (8.5 for w1, etc).
So I go to check my work and see what the average for each customer. Not a single customer comes close to the 26.5. Again, I thought if I added up for all the widgets the average per customer per year, I would be able to model a hypothetical customer for any given year. But the numbers don't check out.
I think this is one of those "The sum of the averages is not equal to the average of the sums" situations. Am I correct?
Is there a better way to calculate the average of something per this thing and per that?
Here's a link to my spreadsheet if you want to see the real numbers:
http://skip@pelorus.org/pictures/CustomerSalesSample.xlsx
Here I have a screenshot of how I tried to do this (unsuccessfully, I should add)
I have recorded the Item, Customer Name, Year and Value. I created the Cust-Year column to help with the first pivot table. I calculate the average for each row in the pivot table. And when I total the average for each widget, I get 26.5, and you can see the values for each individual widget (8.5 for w1, etc).
So I go to check my work and see what the average for each customer. Not a single customer comes close to the 26.5. Again, I thought if I added up for all the widgets the average per customer per year, I would be able to model a hypothetical customer for any given year. But the numbers don't check out.
I think this is one of those "The sum of the averages is not equal to the average of the sums" situations. Am I correct?
Is there a better way to calculate the average of something per this thing and per that?
Here's a link to my spreadsheet if you want to see the real numbers:
http://skip@pelorus.org/pictures/CustomerSalesSample.xlsx


