Change color by set point not showing in the format pane of excel

steveo0707

Board Regular
Joined
Mar 4, 2013
Messages
85
Office Version
  1. 365
  2. 2019
Platform
  1. Windows
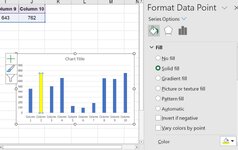
I am trying to set the bars in the below graph to automatically change colors for each individual point. However, the option is not showing up in the format pane.

1686922751845.png
 

Excel Facts

Which Excel functions can ignore hidden rows?
The SUBTOTAL and AGGREGATE functions ignore hidden rows. AGGREGATE can also exclude error cells and more.
If you click twice on a bar you can change its color.
 

Attachments

  • ChartColours.JPG
    ChartColours.JPG
    73.3 KB · Views: 1
Upvote 0

Forum statistics

Threads
1,215,151
Messages
6,123,319
Members
449,094
Latest member
Chestertim

We've detected that you are using an adblocker.

We have a great community of people providing Excel help here, but the hosting costs are enormous. You can help keep this site running by allowing ads on MrExcel.com.
Allow Ads at MrExcel

Which adblocker are you using?

Disable AdBlock

Follow these easy steps to disable AdBlock

1)Click on the icon in the browser’s toolbar.
2)Click on the icon in the browser’s toolbar.
2)Click on the "Pause on this site" option.
Go back

Disable AdBlock Plus

Follow these easy steps to disable AdBlock Plus

1)Click on the icon in the browser’s toolbar.
2)Click on the toggle to disable it for "mrexcel.com".
Go back

Disable uBlock Origin

Follow these easy steps to disable uBlock Origin

1)Click on the icon in the browser’s toolbar.
2)Click on the "Power" button.
3)Click on the "Refresh" button.
Go back

Disable uBlock

Follow these easy steps to disable uBlock

1)Click on the icon in the browser’s toolbar.
2)Click on the "Power" button.
3)Click on the "Refresh" button.
Go back
Back
Top