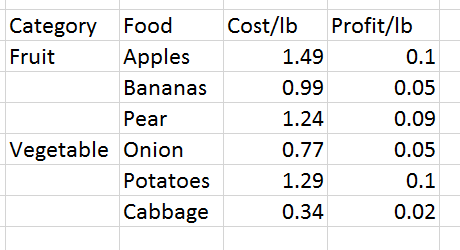
Chart which changes when data is autofiltered

honkin

Active Member
Joined
Mar 20, 2012
Messages
374
Office Version
  1. 2016
Platform
  1. MacOS
I have a sheet which has a chart in which shows the ongoing profit on the Y axis and the number of matches on the X axis. When I filter the sheet, the chart does not alter. How is it possible to have the chart only reflect the visible cells?

The data sets are Profit is AG21:AG883 and Matches is AH21:AH883

Is what I'm after possible at all: to have the chart change to reflect ONLY what is visible?

Thanks in advance
 

Excel Facts

Quick Sum
Select a range of cells. The total appears in bottom right of Excel screen. Right-click total to add Max, Min, Count, Average.
See if this article helps

 
Upvote 0

Forum statistics

Threads
1,215,007
Messages
6,122,670
Members
449,091
Latest member
peppernaut

We've detected that you are using an adblocker.

We have a great community of people providing Excel help here, but the hosting costs are enormous. You can help keep this site running by allowing ads on MrExcel.com.
Allow Ads at MrExcel

Which adblocker are you using?

Disable AdBlock

Follow these easy steps to disable AdBlock

1)Click on the icon in the browser’s toolbar.
2)Click on the icon in the browser’s toolbar.
2)Click on the "Pause on this site" option.
Go back

Disable AdBlock Plus

Follow these easy steps to disable AdBlock Plus

1)Click on the icon in the browser’s toolbar.
2)Click on the toggle to disable it for "mrexcel.com".
Go back

Disable uBlock Origin

Follow these easy steps to disable uBlock Origin

1)Click on the icon in the browser’s toolbar.
2)Click on the "Power" button.
3)Click on the "Refresh" button.
Go back

Disable uBlock

Follow these easy steps to disable uBlock

1)Click on the icon in the browser’s toolbar.
2)Click on the "Power" button.
3)Click on the "Refresh" button.
Go back
Back
Top