Comparing 3 tables to a list of numbers, if match, return 4 columns worth of data on another tab

classichemp

New Member
Joined
Apr 1, 2024
Messages
3
Office Version
  1. 365
Platform
  1. Windows
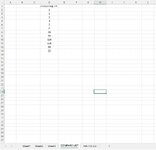
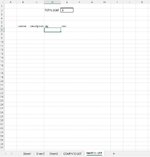
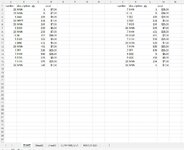
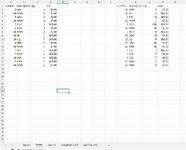
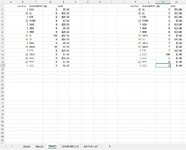
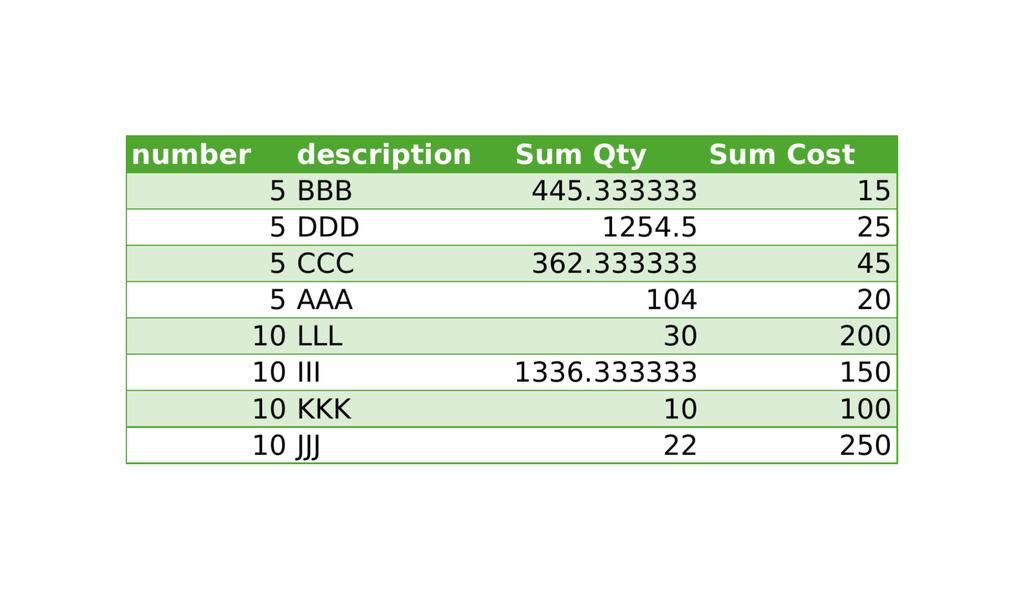
I am a beginner at VBA and I believe what I require is a VBA code to help me solve what I am trying to accomplish. I have a list of numbers, and 3 tabs of tables. If any of the list of numbers match the number in any of those tabs, it will return the "number" along with the "Description", qty, and "cost" columns on another tab. in the end I should have a complete list of every time the compare list of numbers matches the numbers on any of those 3 tabs. Also, ideally, it would be nice to put the list of matching numbers in numerical order and add up the costs of all the numbers in a total cost section. Another possible addition I may or may not need is to consolidate all the same numbers that appear and add up the total quantity so that its 1 line per number with the total amount used.

I don't know where to start, tried to copy and modify sample code off the net but got no where.
 

Attachments

  • compare list tab.JPG
    compare list tab.JPG
    70 KB · Views: 5
  • match list tab.JPG
    match list tab.JPG
    64.5 KB · Views: 5
  • sheet1.JPG
    sheet1.JPG
    114 KB · Views: 4
  • sheet2.JPG
    sheet2.JPG
    111.3 KB · Views: 3
  • sheet3.JPG
    sheet3.JPG
    110.6 KB · Views: 4

Excel Facts

Lock one reference in a formula
Need 1 part of a formula to always point to the same range? use $ signs: $V$2:$Z$99 will always point to V2:Z99, even after copying
This will be a lot easier to resolve if you post a file to a third party location, ie. Box.Net or Dropbox.com. In that manner, no one here will have to retype all your data to test a solution that they have derived. Is there any particular reason that each tab has two sets of data? Why not have all the data in one range per tab?
 
Upvote 0
This will be a lot easier to resolve if you post a file to a third party location, ie. Box.Net or Dropbox.com. In that manner, no one here will have to retype all your data to test a solution that they have derived. Is there any particular reason that each tab has two sets of data? Why not have all the data in one range per tab?
Hi, The 2 sets of data on each tab is how our internal program works with our reports, i have no way of changing that unfortunately. I will work on getting the workbook uploaded to something for all. Thanks.
 
Upvote 0
This will be a lot easier to resolve if you post a file to a third party location, ie. Box.Net or Dropbox.com. In that manner, no one here will have to retype all your data to test a solution that they have derived. Is there any particular reason that each tab has two sets of data? Why not have all the data in one range per tab?
Here is the link
TEST DATA.xlsx
 
Upvote 0
In the file attached,
1. For each range of data, I transformed the range to a table. They are named Table1...Table7
2. Each table was imported to Power Query in a new workbook.
3. Tables 1 to 6 were appended to each other in a new query
4. Once the append query was created, they were grouped by number and description.
5. The grouped query was merged (joined with an outer join) with the comparing number table.

The end result is shown below and all the Mcode can be reflected in the attached file.

Book2
ABCD
1numberdescriptionSum QtySum Cost
25BBB445.333333315
35DDD1254.525
45CCC362.333333345
55AAA10420
610LLL30200
710III1336.333333150
810KKK10100
910JJJ22250
Merge1


Power Query is a free AddIn for Excel 2010 and 2013, and is built-in functionality from Excel 2016 onwards (where it is referred to as "Get & Transform Data").

It is a powerful yet simple way of getting, changing and using data from a broad variety of sources, creating steps which may be easily repeated and refreshed. I strongly recommend learning how to use Power Query - it's among the most powerful functionalities of Excel.

- Follow this link to learn how to install Power Query in Excel 2010 / 2013.

- Follow this link for an introduction to Power Query functionality.

- Follow this link for a video which demonstrates how to use Power Query code provided.
 
Upvote 0

Forum statistics

Threads
1,215,212
Messages
6,123,653
Members
449,111
Latest member
ghennedy

We've detected that you are using an adblocker.

We have a great community of people providing Excel help here, but the hosting costs are enormous. You can help keep this site running by allowing ads on MrExcel.com.
Allow Ads at MrExcel

Which adblocker are you using?

Disable AdBlock

Follow these easy steps to disable AdBlock

1)Click on the icon in the browser’s toolbar.
2)Click on the icon in the browser’s toolbar.
2)Click on the "Pause on this site" option.
Go back

Disable AdBlock Plus

Follow these easy steps to disable AdBlock Plus

1)Click on the icon in the browser’s toolbar.
2)Click on the toggle to disable it for "mrexcel.com".
Go back

Disable uBlock Origin

Follow these easy steps to disable uBlock Origin

1)Click on the icon in the browser’s toolbar.
2)Click on the "Power" button.
3)Click on the "Refresh" button.
Go back

Disable uBlock

Follow these easy steps to disable uBlock

1)Click on the icon in the browser’s toolbar.
2)Click on the "Power" button.
3)Click on the "Refresh" button.
Go back
Back
Top