Conditional formatting/formula highlight based on dates matching in row - Gantt chart

Minilin

New Member
Joined
Oct 19, 2021
Messages
31
Office Version
  1. 365
Platform
  1. Windows
Hiya,

I'm back again with another Gantt based query.

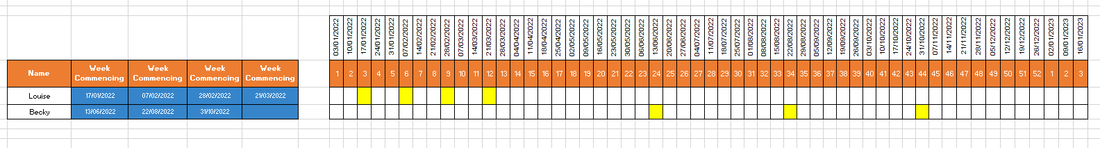
I would like to plot multiple holiday dates on the same row in a gantt chart against someone's name.

I thought there might be a way of doing this via conditional formatting but open to any possible formulas either.

Please see attached picture mock up of what I want to achieve.

Currently, I have to put these in one row at a time and, as you can imagine, that is making the chart massive and unusable.

Cheers
 

Attachments

  • example holiday gantt.png
    example holiday gantt.png
    19.6 KB · Views: 13

Excel Facts

Links? Where??
If Excel says you have links but you can't find them, go to Formulas, Name Manager. Look for old links to dead workbooks & delete.

Forum statistics

Threads
1,215,446
Messages
6,124,896
Members
449,194
Latest member
JayEggleton

We've detected that you are using an adblocker.

We have a great community of people providing Excel help here, but the hosting costs are enormous. You can help keep this site running by allowing ads on MrExcel.com.
Allow Ads at MrExcel

Which adblocker are you using?

Disable AdBlock

Follow these easy steps to disable AdBlock

1)Click on the icon in the browser’s toolbar.
2)Click on the icon in the browser’s toolbar.
2)Click on the "Pause on this site" option.
Go back

Disable AdBlock Plus

Follow these easy steps to disable AdBlock Plus

1)Click on the icon in the browser’s toolbar.
2)Click on the toggle to disable it for "mrexcel.com".
Go back

Disable uBlock Origin

Follow these easy steps to disable uBlock Origin

1)Click on the icon in the browser’s toolbar.
2)Click on the "Power" button.
3)Click on the "Refresh" button.
Go back

Disable uBlock

Follow these easy steps to disable uBlock

1)Click on the icon in the browser’s toolbar.
2)Click on the "Power" button.
3)Click on the "Refresh" button.
Go back
Back
Top