Basic Gantt Chart - how to use conditional formatting to highlight percentage allocation per project

Eddie65789

New Member
Joined
Jan 23, 2024
Messages
7
Office Version
  1. 2021
Platform
  1. Windows
Hello,

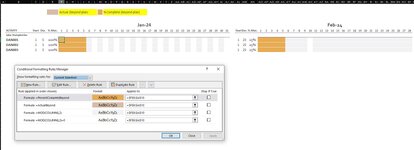
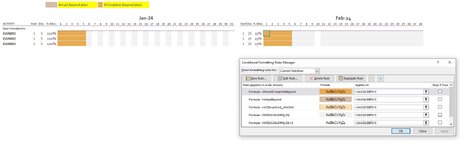
I was hoping the community can help me. I downloaded a standard Gantt template form Excel and have begun modifying it. I would like to present 3 months of data side by side in the same worksheet (only two shown in the images).

The challenge I have is that I can't seem to replicate the conditional formatting for the Feb data, its pulling through the data from columns C- E, rather than AL-AN. I'm not sure if the formulas used in the conditional formatting can used twice in one worksheet. PIC1 has the conditional formatting setting for Jan and PIC2, the conditional formatting for Feb.

Please let me know if any further information is required.

Thanks!
 

Attachments

  • PIC1.JPG
    PIC1.JPG
    100.9 KB · Views: 10
  • PIC2.JPG
    PIC2.JPG
    94.5 KB · Views: 8

Excel Facts

Using Function Arguments with nested formulas
If writing INDEX in Func. Arguments, type MATCH(. Use the mouse to click inside MATCH in the formula bar. Dialog switches to MATCH.
Please list the ranges for the defined ranges or table headings. If you can provide a xl2bb of the worksheet (link below) it would really helpful. If you cannot use the add in, then please paste a list of the defined range names and address, or table.

Thanks in advance.
 
Upvote 0
Gantt project planner1.xlsx
ABCDEFGHIJKLMNOPQRSTUVWXYZAAABACADAEAFAGAHAIAJAKALAMANAOAPAQARASATAUAVAWAXAYAZBABBBCBDBEBFBGBHBIBJBKBLBMBNBOBPBQBR
1
2Actual (beyond plan)% Complete (beyond plan)
3
4
5##
6ACTIVITYStartDur.% Alloc.12345678910111213141516171819202122232425262728293031StartDur.% Alloc.12345678910111213141516171819202122232425262728
7Jake Humpheries
8DAN00115100%12525%
9DAN00215100%12525%
10DAN00315100%12525%
11
Test
Cells with Conditional Formatting
CellConditionCell FormatStop If True
AO8:BP10Expression=PercentCompleteBeyondtextNO
AO8:BP10Expression=ActualBeyondtextNO
AO8:BP10Expression=AO$6=period_selectedtextNO
AO8:BP10Expression=MOD(COLUMN(),50)textNO
AO8:BP10Expression=MOD(COLUMN(),50)=0textNO
F8:AJ10Expression=PercentCompleteBeyondtextNO
F8:AJ10Expression=ActualBeyondtextNO
AP6:BP6,F6:AJ7Expression=F$6=period_selectedtextNO
F8:AJ10Expression=MOD(COLUMN(),2)textNO
F8:AJ10Expression=MOD(COLUMN(),2)=0textNO
Cells with Data Validation
CellAllowCriteria
B1:B2Any value
AL6:AL7Any value
AM6:AM7Any value
AN6:AN7Any value
M2Any value
D2Any value
E2Any value
A1Any value
F4:F5Any value
B3:B7Any value
C3:C7Any value
D3:D7Any value
E3:E7Any value
 
Upvote 0
Please list the ranges for the defined ranges or table headings. If you can provide a xl2bb of the worksheet (link below) it would really helpful. If you cannot use the add in, then please paste a list of the defined range names and address, or table.

Thanks in advance.
Done, hopefully that helps and thanks for your patience.
 
Upvote 0
thanks, for some reason the named ranges were not in the xl2bb paste. I'll assume E2 and M2 are "Actual" and "Complete" named ranges?
 
Upvote 0
thanks, for some reason the named ranges were not in the xl2bb paste. I'll assume E2 and M2 are "Actual" and "Complete" named ranges?
I amended this from a template, if I delete out line 2 it doesn't seem to make any difference to teh current functionality.
 
Upvote 0
Hopefully this is a little clearer. I'm attempting to have independent Gannt charts for each month, currently the data for month 1 and 2 are linked.


Gantt project planner1.xlsx
ABCDEFGHIJKLMNOPQRSTUVWXYZAAABACADAEAFAGAHAIAJAKALAMANAOAPAQARASATAUAVAWAXAYAZBABBBCBDBEBFBGBHBIBJBKBLBMBNBOBPBQ
1
2
3
4
5ACTIVITYStartDur.% Alloc.12345678910111213141516171819202122232425262728293031StartDur.% Alloc.12345678910111213141516171819202122232425262728
6Jake Humpheries
7DAN001110100%12525%
8DAN002510100%12525%
9DAN0031020100%12525%
10
Test
Cells with Conditional Formatting
CellConditionCell FormatStop If True
AO7:BP9Expression=PercentCompleteBeyondtextNO
AO7:BP9Expression=ActualBeyondtextNO
AO7:BP9Expression=AO$5=period_selectedtextNO
AO7:BP9Expression=MOD(COLUMN(),50)textNO
AO7:BP9Expression=MOD(COLUMN(),50)=0textNO
F7:AJ9Expression=PercentCompleteBeyondtextNO
F7:AJ9Expression=ActualBeyondtextNO
AP5:BP5,F5:AJ6Expression=F$5=period_selectedtextNO
F7:AJ9Expression=MOD(COLUMN(),2)textNO
F7:AJ9Expression=MOD(COLUMN(),2)=0textNO
Cells with Data Validation
CellAllowCriteria
AL5:AL6Any value
AM5:AM6Any value
AN5:AN6Any value
A1Any value
B1Any value
B2Any value
C2Any value
D2Any value
E2Any value
B5:B6Any value
C5:C6Any value
D5:D6Any value
E5:E6Any value
 
Upvote 0
I still don't understand the named range references. Where are they defined? What are the rules for changing colors?
What cells are in the ranges:
"PercentCompleteBeyond"
"ActualBeyond"
"period_selected"


If these are just defined names, then you need to be sure to included the named ranges definitions.
If they are from a table, please post the table.

If you click the check box "Named Ranges" in the "Additional Info" section of the XL2BB ribbon, they should be pasted with the mini worksheet.

And a text definition of what you mean by :
"ActualBeyond"
"PercentCompleteBeyond"
and
"period_selected"
1s really needed.
 
Last edited:
Upvote 0
Hello, thanks for patience, this is a unknown are of Excel for me.

The "Named Ranges" and "Additional Info" options were selected when I initiated the mini worksheet.

As I mentioned at the start, I have altered the "Gantt Project Planner" template available in Excel.

From what I can tell, the conditional formatting is using data from columns B - D, rows 7-9 to determine the start point and end point of teh displayed orange bar.

I have never seen the formulas "PercentCompleteBeyond" and "ActualBeyond" used as arguments in the conditional formatting.
 
Upvote 0
Those names are part of your CF rules, so they are in there.

click on name manger and see if there are any names defined?
FORMULAS ribbon, Name Manager.

What is your "idea" in text, that would make a cell PINK.
I'm assuming the orange is for the "scheduled" activity range.

And that you input the percentage complete in the percent column?
 
Upvote 0

Forum statistics

Threads
1,215,071
Messages
6,122,963
Members
449,094
Latest member
Anshu121

We've detected that you are using an adblocker.

We have a great community of people providing Excel help here, but the hosting costs are enormous. You can help keep this site running by allowing ads on MrExcel.com.
Allow Ads at MrExcel

Which adblocker are you using?

Disable AdBlock

Follow these easy steps to disable AdBlock

1)Click on the icon in the browser’s toolbar.
2)Click on the icon in the browser’s toolbar.
2)Click on the "Pause on this site" option.
Go back

Disable AdBlock Plus

Follow these easy steps to disable AdBlock Plus

1)Click on the icon in the browser’s toolbar.
2)Click on the toggle to disable it for "mrexcel.com".
Go back

Disable uBlock Origin

Follow these easy steps to disable uBlock Origin

1)Click on the icon in the browser’s toolbar.
2)Click on the "Power" button.
3)Click on the "Refresh" button.
Go back

Disable uBlock

Follow these easy steps to disable uBlock

1)Click on the icon in the browser’s toolbar.
2)Click on the "Power" button.
3)Click on the "Refresh" button.
Go back
Back
Top