Dynamic Chart Help

dext

New Member
Joined
Jun 27, 2023
Messages
12
Office Version
  1. 365
Platform
  1. Windows
Hi,

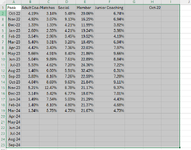
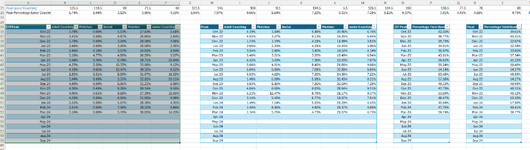
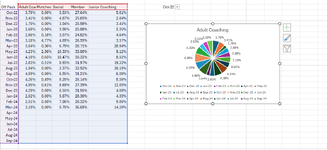
I seem to be having issues trying to create a dynamic chart, i have the following information, I have a drop down menu in column h1 which has all my months listed from October 22 - September 24, i then try and insert a pie chart, but everything i try i cannot get this pie chart to change with the months, can anyone help and give me step by step instructions, I've been trying for two days and getting nowhere.
 

Attachments

  • screenshot1.png
    screenshot1.png
    45.4 KB · Views: 6

Excel Facts

Can you AutoAverage in Excel?
There is a drop-down next to the AutoSum symbol. Open the drop-down to choose AVERAGE, COUNT, MAX, or MIN
I don't see any of the rows adding to 100%, which is what pie charts usually do?
So, please tell us what row or section of column is supposed to be in your pie?

please describe what you wouild want in a static chart. and then we can try to figure out how to make it dynamic.
 
Upvote 0
this is the 4 tables i have created, i need a pie chart for each individual table, this is basically a utilisation chart, it will not add up to 100% i can create the drop down, i just cant link it together so the pie chart changes it just wont work whatever i do
 

Attachments

  • Screenshot 2024-05-01 114316.png
    Screenshot 2024-05-01 114316.png
    92.7 KB · Views: 3
Upvote 0
please to help me understand. Just give me the values needed for 1 pie and 1 pie only? (what range(A:5:A10 or A5:E5))
 
Upvote 0
this is what i get when i create the pie chart
 

Attachments

  • Screenshot 2024-05-01 115015.png
    Screenshot 2024-05-01 115015.png
    80 KB · Views: 3
Upvote 0
Ok and you want to make it dynamic as you add more rows?
 
Upvote 0
please to help me understand. Just give me the values needed for 1 pie and 1 pie only? (what range(A:5:A10 or A5:E5))
ok so october 22 will show the percentages for adult coaching, matches, social, member, junior coaching, in the pie chart, and then whenever i use the drop down menu for the different months it will change the pie chart
 
Upvote 0
Make a dedicated area for the values to feed into the chart. Driven by a drop down. You can move the chart over the dedicated area so it is obscured, or put it in an area away from view.

But, pie charts have gone out of disfavor for visualizations. A bar or column chart that is sorted descending or ascending is more descriptive. Especially since you are not adding up to 100%.
drop down is in J2 (Yellow Highlight)

or you could use the MAX function to determine the last row:
Book1
JKLMNO
2Sep-24
3Adult CoachingMatchesSocialMemberJunior Coaching
47.13%3.85%7.92%6.51%5.45%
Sheet1
Cell Formulas
RangeFormula
J2J2=MAX(A3:A500)
J4:N4J4=INDEX(B3:F26,MATCH(MAX(A3:A500),A3:A26,0),0)
Dynamic array formulas.


Book1
ABCDEFGHIJKLMNOP
1
2Adult CoachingMatchesSocialMemberJunior CoachingSelect M/Y:Dec-22
3Oct-229.85%5.45%5.81%4.02%6.94%Adult CoachingMatchesSocialMemberJunior Coaching
4Nov-226.89%4.74%1.74%2.17%6.05%7.22%9.30%7.91%7.30%6.81%
5Dec-227.22%9.30%7.91%7.30%6.81%
6Jan-232.60%9.37%4.05%7.27%9.13%
7Feb-238.80%5.88%7.34%7.27%7.01%
8Mar-238.53%4.67%1.43%8.07%6.55%
9Apr-239.79%9.57%3.02%4.52%3.97%
10May-232.69%4.78%7.67%3.37%2.58%
11Jun-239.12%9.84%4.27%8.60%5.32%
12Jul-238.49%8.77%7.87%5.16%7.38%
13Aug-237.80%5.44%8.31%7.72%3.20%
14Sep-234.23%8.41%7.03%5.58%5.03%
15Oct-231.85%3.41%2.82%6.19%3.62%
16Nov-235.99%7.53%6.01%3.14%9.16%
17Dec-238.35%9.80%7.17%7.13%7.73%
18Jan-246.00%2.69%4.21%2.84%3.93%
19Feb-244.61%1.46%7.40%1.08%8.58%
20Mar-247.73%9.22%1.73%5.97%9.83%
21Apr-249.25%8.46%8.03%3.68%4.58%
22May-242.28%7.35%3.48%4.33%1.85%
23Jun-242.79%7.57%9.64%1.09%4.95%
24Jul-244.19%9.35%7.97%8.53%2.58%
25Aug-244.45%2.82%4.95%5.67%3.19%
26Sep-247.13%3.85%7.92%6.51%5.45%
Sheet1
Cell Formulas
RangeFormula
J4:N4J4=INDEX(B3:F26,MATCH(J2,A3:A26,0),0)
Dynamic array formulas.
Cells with Data Validation
CellAllowCriteria
J2List=$A$3:$A$26


1714561953304.png
 
Last edited:
Upvote 0

Forum statistics

Threads
1,216,049
Messages
6,128,496
Members
449,455
Latest member
jesski

We've detected that you are using an adblocker.

We have a great community of people providing Excel help here, but the hosting costs are enormous. You can help keep this site running by allowing ads on MrExcel.com.
Allow Ads at MrExcel

Which adblocker are you using?

Disable AdBlock

Follow these easy steps to disable AdBlock

1)Click on the icon in the browser’s toolbar.
2)Click on the icon in the browser’s toolbar.
2)Click on the "Pause on this site" option.
Go back

Disable AdBlock Plus

Follow these easy steps to disable AdBlock Plus

1)Click on the icon in the browser’s toolbar.
2)Click on the toggle to disable it for "mrexcel.com".
Go back

Disable uBlock Origin

Follow these easy steps to disable uBlock Origin

1)Click on the icon in the browser’s toolbar.
2)Click on the "Power" button.
3)Click on the "Refresh" button.
Go back

Disable uBlock

Follow these easy steps to disable uBlock

1)Click on the icon in the browser’s toolbar.
2)Click on the "Power" button.
3)Click on the "Refresh" button.
Go back
Back
Top