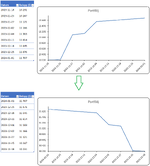
how can i sort table without line-chart getting reversed?

rexcel3

New Member
Joined
Apr 16, 2022
Messages
31
Office Version
  1. 2021
Platform
  1. Windows
how can i sort table by newest or oldest without the chart reversing?

dates r formatted as date.
amounts r formatted as number.
 

Attachments

  • Namnlös.png
    Namnlös.png
    81.1 KB · Views: 21

Excel Facts

Waterfall charts in Excel?
Office 365 customers have access to Waterfall charts since late 2016. They were added to Excel 2019.
Have 2 tables. One for plotting, one for sorting.
 
Upvote 0
Maybe. Or maybe you would set up automation to populate the sort table (or vice-versa). That's what I would do. Because if there is a way to sort your plot table without changing the plot, I don't know of it.
 
Upvote 0
Maybe. Or maybe you would set up automation to populate the sort table (or vice-versa). That's what I would do. Because if there is a way to sort your plot table without changing the plot, I don't know of it.
i dont understand.
could u show how this is done?
 
Upvote 0
If it is a permanent difference ie you are showing both the table and chart in your report and you want one ascending and one descending then you can tell the Chart Axis to show in reverse order.
• Select the Horizontal Lables in the chart.
• Right click > Format Axis (or Ctrl+1)
• Check the box on the last item under Axis Options "Dates in reverse order"


1704234677003.png
 
Upvote 0
Please use XL2BB to post data from a sample table that I can work with.

View attachment 104259
is this correct?

transaktioner.xlsx
BCDEFGHIJKLMNOP
3DatumBelopp ($)
42023-11-1810 231
52023-11-2510 247
62023-11-2711 121
72023-12-0211 166
82023-12-0411 583
92023-12-1111 614
102023-12-1811 645
112023-12-2511 676
122024-01-0111 707
13
14
15
graph
Cell Formulas
RangeFormula
C12C12=11676+31
 
Upvote 0
If it is a permanent difference ie you are showing both the table and chart in your report and you want one ascending and one descending then you can tell the Chart Axis to show in reverse order.
• Select the Horizontal Lables in the chart.
• Right click > Format Axis (or Ctrl+1)
• Check the box on the last item under Axis Options "Dates in reverse order"


View attachment 104261
when i tried this, i believe the y-axis went to the right side of the line-chart.
 
Upvote 0
I must be missing something. Can you explain how you are sorting the range you posted? When I make a line chart using the Range("A3:B12") data you posted and sort the range using col A as the sort key, the line chart does not change when I sort col A ascending or descending.

1704341070591.png


The only time I can make it flip according to your image in post #1 is if I toggle the "Dates in Reverse Order" chart option.
 
Upvote 0

Forum statistics

Threads
1,216,110
Messages
6,128,896
Members
449,477
Latest member
panjongshing

We've detected that you are using an adblocker.

We have a great community of people providing Excel help here, but the hosting costs are enormous. You can help keep this site running by allowing ads on MrExcel.com.
Allow Ads at MrExcel

Which adblocker are you using?

Disable AdBlock

Follow these easy steps to disable AdBlock

1)Click on the icon in the browser’s toolbar.
2)Click on the icon in the browser’s toolbar.
2)Click on the "Pause on this site" option.
Go back

Disable AdBlock Plus

Follow these easy steps to disable AdBlock Plus

1)Click on the icon in the browser’s toolbar.
2)Click on the toggle to disable it for "mrexcel.com".
Go back

Disable uBlock Origin

Follow these easy steps to disable uBlock Origin

1)Click on the icon in the browser’s toolbar.
2)Click on the "Power" button.
3)Click on the "Refresh" button.
Go back

Disable uBlock

Follow these easy steps to disable uBlock

1)Click on the icon in the browser’s toolbar.
2)Click on the "Power" button.
3)Click on the "Refresh" button.
Go back
Back
Top