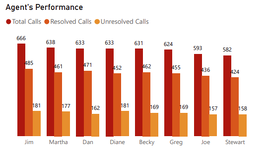
How can we have 3 coloums in a clustered coloum chart as shown in the image

ajesh27

New Member
Joined
Mar 5, 2021
Messages
12
Office Version
  1. 365
Platform
  1. Windows
I wan to show Total call, call resolved and unresolved in the same coloumn chart. how can we attain that. please see the image for reference. Thanks in advance

I am referring to Power BI clustered coloum chart
 

Attachments

  • Cluster coloumn chart.PNG
    Cluster coloumn chart.PNG
    29.1 KB · Views: 9
Last edited by a moderator:

Excel Facts

Select a hidden cell
Somehide hide payroll data in column G? Press F5. Type G1. Enter. Look in formula bar while you arrow down through G.

Forum statistics

Threads
1,215,359
Messages
6,124,488
Members
449,166
Latest member
hokjock

We've detected that you are using an adblocker.

We have a great community of people providing Excel help here, but the hosting costs are enormous. You can help keep this site running by allowing ads on MrExcel.com.
Allow Ads at MrExcel

Which adblocker are you using?

Disable AdBlock

Follow these easy steps to disable AdBlock

1)Click on the icon in the browser’s toolbar.
2)Click on the icon in the browser’s toolbar.
2)Click on the "Pause on this site" option.
Go back

Disable AdBlock Plus

Follow these easy steps to disable AdBlock Plus

1)Click on the icon in the browser’s toolbar.
2)Click on the toggle to disable it for "mrexcel.com".
Go back

Disable uBlock Origin

Follow these easy steps to disable uBlock Origin

1)Click on the icon in the browser’s toolbar.
2)Click on the "Power" button.
3)Click on the "Refresh" button.
Go back

Disable uBlock

Follow these easy steps to disable uBlock

1)Click on the icon in the browser’s toolbar.
2)Click on the "Power" button.
3)Click on the "Refresh" button.
Go back
Back
Top