How to get text labels on X axis of a plot?

JenniferMurphy

Well-known Member
Joined
Jul 23, 2011
Messages
2,535
Office Version
  1. 365
Platform
  1. Windows
I would like to plot this table

image.png


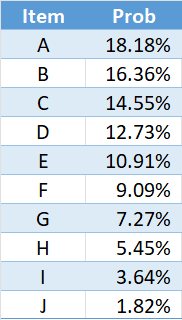
but have the letters in the Item column (A, B, C, ...) on the X Axis, not the numbers 1, 2, 3...

image.png


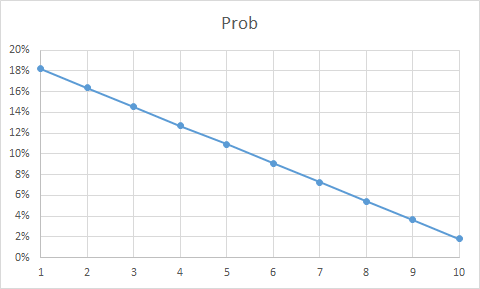
Is there a way to do that?

Thanks
 

Excel Facts

When they said...
When they said you are going to "Excel at life", they meant you "will be doing Excel your whole life".
Looks like you might be using an X.Y scatter chart.
If you change to a line with marker chart you will get the letters on the X axis.

1689133307151.png
 
Upvote 0
Solution

Forum statistics

Threads
1,215,325
Messages
6,124,252
Members
449,149
Latest member
mwdbActuary

We've detected that you are using an adblocker.

We have a great community of people providing Excel help here, but the hosting costs are enormous. You can help keep this site running by allowing ads on MrExcel.com.
Allow Ads at MrExcel

Which adblocker are you using?

Disable AdBlock

Follow these easy steps to disable AdBlock

1)Click on the icon in the browser’s toolbar.
2)Click on the icon in the browser’s toolbar.
2)Click on the "Pause on this site" option.
Go back

Disable AdBlock Plus

Follow these easy steps to disable AdBlock Plus

1)Click on the icon in the browser’s toolbar.
2)Click on the toggle to disable it for "mrexcel.com".
Go back

Disable uBlock Origin

Follow these easy steps to disable uBlock Origin

1)Click on the icon in the browser’s toolbar.
2)Click on the "Power" button.
3)Click on the "Refresh" button.
Go back

Disable uBlock

Follow these easy steps to disable uBlock

1)Click on the icon in the browser’s toolbar.
2)Click on the "Power" button.
3)Click on the "Refresh" button.
Go back
Back
Top