Good Day
I'm having an issue with this line graph attached.
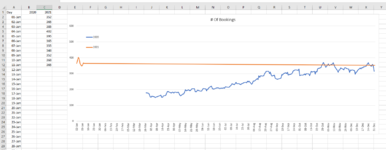
Basically I am keeping a running daily total year on year, I want the line graph to connect the lines for missing dates inbetween data but as you can see below, this new year has a giant line (orange) across the graph even though data isnt entered that far out as yet.
Any ideas on how to fix? I just have dummy info in 2021 currently but eventually in April this year there will be two lines that are close and I can see visually the difference from last year.
Thanks
I'm having an issue with this line graph attached.
Basically I am keeping a running daily total year on year, I want the line graph to connect the lines for missing dates inbetween data but as you can see below, this new year has a giant line (orange) across the graph even though data isnt entered that far out as yet.
Any ideas on how to fix? I just have dummy info in 2021 currently but eventually in April this year there will be two lines that are close and I can see visually the difference from last year.
Thanks