misterj0shua
New Member
- Joined
- Jan 17, 2022
- Messages
- 4
- Office Version
- 365
- 2021
- Platform
- Windows
Please bear with me as I haven't taken a geometry class in a while and I have done a ton of research, but can't find the exact answer to my question. I found a solution, but its not the best solution, so I want to make sure there isn't another one.
I have 4 points I want to graph. Each point has 2 values for example: (21 100) (34 112) (42 120) (58 110)
9.6 107.8
11.4 108.8
13.9 111.3
14.3 109.9
Now these values I am trying to graph on a scatter graph with a smooth line and it would look something like a bell curve with the first numbers (21-58) on the X axis and the second number (100-120) on the Y axis.
The problem is when these numbers are entered they may be entered out of order. So using the example above
9.6 107.8
11.4 108.8
14.3 109.9
13.9 111.3
now when I plot these on the scatter graph with a smooth line the graph connects the dots as entered. So now instead of a nice curve I have a goofy curve, because instead of connecting points 1,2,4, and 3 in a nice line it goes 1,2,3,4.
So let me start with what I have learned so far:
I understand the relation these numbers have to each other as the left column will always continue to go up and the right column as some point will reach a max and then drop off (120 -----> 110).
I also understand that I could sort the left column, but the numbers in the right column would have to follow the numbers on the left as they are related. However, since this is an automated process I would have to use a formula to do it and I am currently looking into that.
So I am wondering if there is an option in the graph that just connects the points together left to right without worrying about if its point 1 or 3. Its just whatever is closest it gets connected too. So in the example above it would connect points 1,2,4,3. I hope that makes sense. So you plot the 4 points and then just connect them with a line.
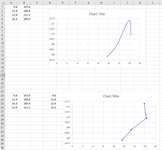
If I am unclear about what I need please ask. I posted a picture which i hope helps clarify. Basically how do i make the bottom chart look like the top chart with the data points entered as is.
I have 4 points I want to graph. Each point has 2 values for example: (21 100) (34 112) (42 120) (58 110)
9.6 107.8
11.4 108.8
13.9 111.3
14.3 109.9
Now these values I am trying to graph on a scatter graph with a smooth line and it would look something like a bell curve with the first numbers (21-58) on the X axis and the second number (100-120) on the Y axis.
The problem is when these numbers are entered they may be entered out of order. So using the example above
9.6 107.8
11.4 108.8
14.3 109.9
13.9 111.3
now when I plot these on the scatter graph with a smooth line the graph connects the dots as entered. So now instead of a nice curve I have a goofy curve, because instead of connecting points 1,2,4, and 3 in a nice line it goes 1,2,3,4.
So let me start with what I have learned so far:
I understand the relation these numbers have to each other as the left column will always continue to go up and the right column as some point will reach a max and then drop off (120 -----> 110).
I also understand that I could sort the left column, but the numbers in the right column would have to follow the numbers on the left as they are related. However, since this is an automated process I would have to use a formula to do it and I am currently looking into that.
So I am wondering if there is an option in the graph that just connects the points together left to right without worrying about if its point 1 or 3. Its just whatever is closest it gets connected too. So in the example above it would connect points 1,2,4,3. I hope that makes sense. So you plot the 4 points and then just connect them with a line.
If I am unclear about what I need please ask. I posted a picture which i hope helps clarify. Basically how do i make the bottom chart look like the top chart with the data points entered as is.