hi everyone,
I am trying to build a graph from data taken out a table (price evoution per date).
the table can be filtered to only list the info from a given country, so some rows will be hidden in the table.
note that (and this is important): some countries have more data than others (i.e. more date, so more price data).
another info in the table data is the fact that a program was running or not at a given date (column will show yes or no at a given date, a program will always run more than one day).
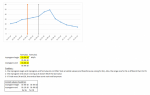
in the graph, i want to two vertical bars, one for the starting date of the program, and one for the end date of the program.
the vertical bars are fetching the date from specific cells (not in the table).
i have everything setup (graph dynamically showing based on how table is filtered, two vertical bars etc), however there are some issues i am running into :
1- i want the cells with the start date and end date to be dynamic and based only on visible cells from the data table (i.e. if i change the filter on the table, the data will change, some rows will be hidden). the formula I have today (an index/match, but same issue with a lookup) doesnt look at visible cells only, so the values are wrong. also, since the size of data can vary from a country to another, the formula should be somewhat variable on the range...
2- i am struggling to find a formula to find the end date
I tried such formula
but it does work (even with ctrl+shift+enter)
any idea of what i did wrong ?
attached is a screenshot, not sure how to attach an excel file, hopefully that can help
I am trying to build a graph from data taken out a table (price evoution per date).
the table can be filtered to only list the info from a given country, so some rows will be hidden in the table.
note that (and this is important): some countries have more data than others (i.e. more date, so more price data).
another info in the table data is the fact that a program was running or not at a given date (column will show yes or no at a given date, a program will always run more than one day).
in the graph, i want to two vertical bars, one for the starting date of the program, and one for the end date of the program.
the vertical bars are fetching the date from specific cells (not in the table).
i have everything setup (graph dynamically showing based on how table is filtered, two vertical bars etc), however there are some issues i am running into :
1- i want the cells with the start date and end date to be dynamic and based only on visible cells from the data table (i.e. if i change the filter on the table, the data will change, some rows will be hidden). the formula I have today (an index/match, but same issue with a lookup) doesnt look at visible cells only, so the values are wrong. also, since the size of data can vary from a country to another, the formula should be somewhat variable on the range...
2- i am struggling to find a formula to find the end date
I tried such formula
VBA Code:
=INDEX(values!$A$2:$D$26,MATCH("yes",IF(SUBTOTAL(3,OFFSET(values!$A$3,ROW(values!$A$3:$A$25)-ROW(values!$A$3),0)),COUNTIF(values!$A$3:A3, values!$A$3:$D$25)),0),1)any idea of what i did wrong ?
attached is a screenshot, not sure how to attach an excel file, hopefully that can help