Moving average based on 'hidden' data

nielf

Board Regular
Joined
Nov 13, 2012
Messages
69
Hi,

I have create a Power PivotTable (2010) with sales data from each month from 2011 - today. From the PivotTable I have created a PivotChart.

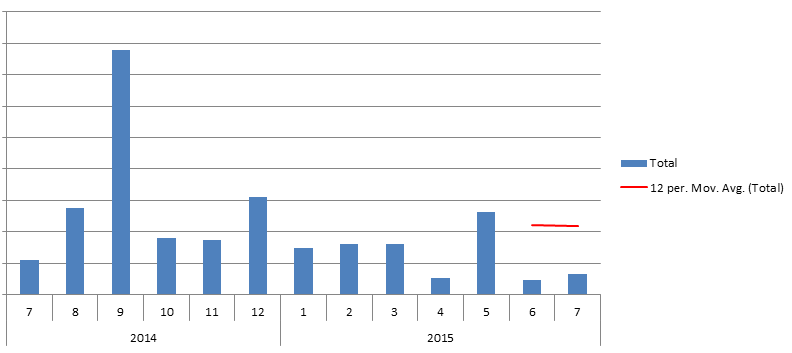
I only want to see sales data from the last 13 months in my chart so i have created a report filter for that. However, I would also like to see a 12 months moving average in the chart.

nOYWcTG.png


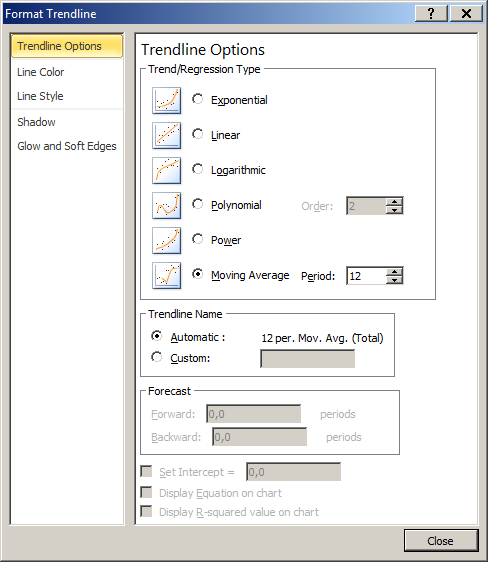
The problem is, that since I'm only showing data from the last 13 months in my chart due to my report filter, Excel cannot calculate the moving average for all the months in the chart - even though the data is available but 'hidden'. Is there any workaround for this?

DQWS9r0.png
 

Excel Facts

Excel Wisdom
Using a mouse in Excel is the work equivalent of wearing a lanyard when you first get to college
I encountered this very issue once. I couldn't figure out how to make the charting feature grab the so-called hidden data. So I created a helper column that contained the 12-mo MA and added it as a series to the chart.
 
Upvote 0
I encountered this very issue once. I couldn't figure out how to make the charting feature grab the so-called hidden data. So I created a helper column that contained the 12-mo MA and added it as a series to the chart.

That was also my initial thought. I just need to figure out how to do that for my 200,000 rows in PowerPivot. I would like to end up with a solution where I'm able to slice the data.
 
Upvote 0
It typically looks something like:

12MoAvg := CALCULATE([Total], FILTER(ALL(Calendar), Calendar[MonthNum] > MAX(Calendar[MonthNum]) - 11)) / 12

It can break down a bit if your data doesn't go far enough back, in which case you need to massage it a bit to divide by the number of months you actually HAVE...
 
Upvote 0
Thanks for the reply scottsen.

I have been on vacation so I haven't had time to play around with it yet but I hope your formula can bring me in the right direction.
 
Upvote 0
I'm a bit stuck here. I haven't been able to figure out how to calculate the 12 Months Moving Average although you tried to guide me, scottsen.

Perhaps you can help me by looking at this sample file. In the file I have calculated Hitrate of the Month based on sum and count using the formulas below:

SUM:
=CALCULATE(SUM(Data[SalesPrice]),Data[Status]="Awarded")/((CALCULATE(SUM(Data[SalesPrice]),Data[Status]="Awarded"))+CALCULATE(SUM(Data[SalesPrice]),Data[Status]="Lost"))

COUNT:
=COUNTROWS(FILTER(Data,Data[Status]="Awarded"))/(COUNTROWS(FILTER(Data,Data[Status]="Awarded"))+COUNTROWS(FILTER(Data,Data[Status]="Lost")))

I've come this far which is great but the real value lies in calculating the 12 months moving average and I can't figure that out.
 
Upvote 0

Forum statistics

Threads
1,215,066
Messages
6,122,948
Members
449,095
Latest member
nmaske

We've detected that you are using an adblocker.

We have a great community of people providing Excel help here, but the hosting costs are enormous. You can help keep this site running by allowing ads on MrExcel.com.
Allow Ads at MrExcel

Which adblocker are you using?

Disable AdBlock

Follow these easy steps to disable AdBlock

1)Click on the icon in the browser’s toolbar.
2)Click on the icon in the browser’s toolbar.
2)Click on the "Pause on this site" option.
Go back

Disable AdBlock Plus

Follow these easy steps to disable AdBlock Plus

1)Click on the icon in the browser’s toolbar.
2)Click on the toggle to disable it for "mrexcel.com".
Go back

Disable uBlock Origin

Follow these easy steps to disable uBlock Origin

1)Click on the icon in the browser’s toolbar.
2)Click on the "Power" button.
3)Click on the "Refresh" button.
Go back

Disable uBlock

Follow these easy steps to disable uBlock

1)Click on the icon in the browser’s toolbar.
2)Click on the "Power" button.
3)Click on the "Refresh" button.
Go back
Back
Top