Dandada2602
New Member
- Joined
- Nov 22, 2018
- Messages
- 13
Hi,
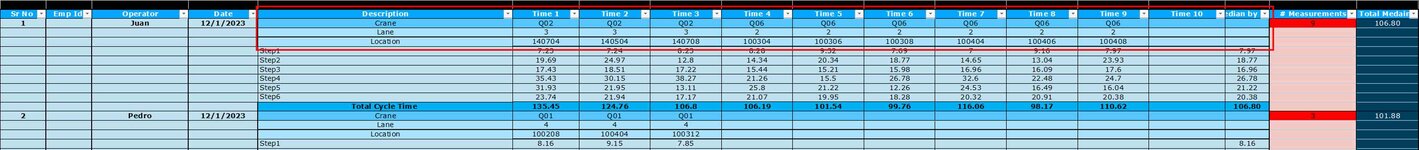
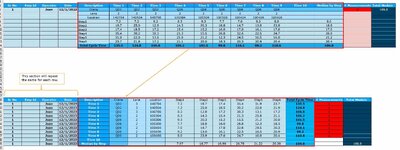
Im doing a time measurement of cycle times per operator. The sheet use to track the time for each name has title rows that describe crane , lane, location where the measurement was taken (see image is the area in the red box). This is done per each operator. I'm trying to unpivot the data for a more usable to be able to analyze. I just can figure out how to unpivot the data. Consider I have several sheets and longer list of data for this reason I need help with guidance.
This is the data:
| Sr No | Emp Id | Operator |
| Description | Time 1 | Time 2 | Time 3 | Time 4 | Time 5 | Time 6 | Time 7 | Time 8 | Time 9 | Time 10 | Median by Step | # Measurements | Total Medain | |
| 1 | Juan | 12/1/2023 | Crane | Q02 | Q02 | Q02 | Q06 | Q06 | Q06 | Q06 | Q06 | Q06 | 9 | 106.80 | ||||
| Lane | 3 | 3 | 3 | 2 | 2 | 2 | 2 | 2 | 2 | |||||||||
| Location | 140704 | 140504 | 140708 | 100304 | 100306 | 100308 | 100404 | 100406 | 100408 | |||||||||
| Step1 | 7.23 | 7.24 | 8.23 | 8.28 | 9.32 | 7.69 | 7 | 9.16 | 7.97 | 7.97 | ||||||||
| Step2 | 19.69 | 24.97 | 12.8 | 14.34 | 20.34 | 18.77 | 14.65 | 13.04 | 23.93 | 18.77 | ||||||||
| Step3 | 17.43 | 18.51 | 17.22 | 15.44 | 15.21 | 15.98 | 16.96 | 16.09 | 17.6 | 16.96 | ||||||||
| Step4 | 35.43 | 30.15 | 38.27 | 21.26 | 15.5 | 26.78 | 32.6 | 22.48 | 24.7 | 26.78 | ||||||||
| Step5 | 31.93 | 21.95 | 13.11 | 25.8 | 21.22 | 12.26 | 24.53 | 16.49 | 16.04 | 21.22 | ||||||||
| Step6 | 23.74 | 21.94 | 17.17 | 21.07 | 19.95 | 18.28 | 20.32 | 20.91 | 20.38 | 20.38 | ||||||||
| Total Cycle Time | 135.45 | 124.76 | 106.8 | 106.19 | 101.54 | 99.76 | 116.06 | 98.17 | 110.62 | 106.80 | ||||||||
| 2 | Pedro | 12/1/2023 | Crane | Q01 | Q01 | Q01 | 3 | 101.88 | ||||||||||
| Lane | 4 | 4 | 4 | |||||||||||||||
| Location | 100208 | 100404 | 100312 | |||||||||||||||
| Step1 | 8.16 | 9.15 | 7.85 | 8.16 | ||||||||||||||
| Step2 | 16.16 | 14.73 | 18.49 | 16.16 | ||||||||||||||
| Step3 | 16.61 | 17.85 | 16.87 | 16.87 | ||||||||||||||
| Step4 | 24.35 | 23.3 | 28.7 | 24.35 | ||||||||||||||
| Step5 | 15.37 | 19.82 | 16.92 | 16.92 | ||||||||||||||
| Step6 | 17.67 | 17.03 | 16.58 | 17.03 | ||||||||||||||
| Total Cycle Time | 98.32 | 101.88 | 105.41 | 101.88 | ||||||||||||||
| 3 | Felipe | 12/1/2023 | Crane | Q01 | Q01 | Q01 | Q01 | Q01 | Q01 | Q01 | 7 | 106.90 | ||||||
| Lane | 4 | 4 | 4 | 4 | 4 | 4 | 4 | |||||||||||
| Location | 100502 | 100406 | 100408 | 100604 | 100606 | 100608 | 100610 | |||||||||||
| Step1 | 9.52 | 6.55 | 7.63 | 7.11 | 7.38 | 7.54 | 7.27 | 7.38 | ||||||||||
| Step2 | 19.58 | 26.68 | 13.21 | 15.73 | 26.11 | 13.73 | 18.6 | 18.60 | ||||||||||
| Step3 | 18.65 | 16.64 | 16.9 | 16.54 | 16.62 | 16.85 | 15.87 | 16.64 | ||||||||||
| Step4 | 19.25 | 22.97 | 21.27 | 19.91 | 34.72 | 25.43 | 24.46 | 22.97 | ||||||||||
| Step5 | 31.49 | 21.25 | 16.76 | 23.66 | 15.35 | 11.16 | 11.32 | 16.76 | ||||||||||
| Step6 | 21.18 | 13.92 | 16.65 | 23.95 | 21.56 | 22.41 | 18.62 | 21.18 | ||||||||||
| Total Cycle Time | 119.67 | 108.01 | 92.42 | 106.9 | 121.74 | 97.12 | 96.14 | 106.90 | ||||||||||
| 4 | Maria | Crane | Q02 | Q02 | Q02 | Q02 | Q02 | Q02 | Q02 | Q02 | Q02 | Q02 | 10 | 108.18 | ||||
| Lane | 4 | 4 | 4 | 4 | 4 | 4 | 4 | 4 | 4 | 4 | ||||||||
| Location | 220108 | 220110 | 220202 | 220204 | 220206 | 220302 | 220304 | 220404 | 220406 | 220408 | ||||||||
| Step1 | 9.15 | 8.89 | 8.55 | 10.31 | 9.46 | 8.8 | 9.09 | 9.11 | 8.3 | 8.53 | 8.99 | |||||||
| Step2 | 16.49 | 17.47 | 23.65 | 15.88 | 16.1 | 15.01 | 16.88 | 15.76 | 17.69 | 18.82 | 16.69 | |||||||
| Step3 | 17.47 | 19.69 | 18.66 | 18.94 | 18.23 | 17.77 | 18.5 | 18.81 | 19.48 | 19.1 | 18.74 | |||||||
| Step4 | 25.29 | 28.32 | 28.53 | 22.59 | 28.02 | 22.82 | 29.28 | 28.75 | 22.74 | 27.67 | 27.85 | |||||||
| Step5 | 12.35 | 15.36 | 18.45 | 15.45 | 13.15 | 17.38 | 16.07 | 18.31 | 16.91 | 14.8 | 15.76 | |||||||
| Step6 | 21.39 | 21.2 | 22.9 | 22.14 | 21.87 | 26.18 | 23.54 | 21.97 | 20.55 | 19.48 | 21.92 | |||||||
| Total Cycle Time | 102.14 | 110.93 | 120.74 | 105.31 | 106.83 | 107.96 | 113.36 | 112.71 | 105.67 | 108.4 | 108.2 | |||||||
| 5 | Ana | 12/27/2023 | Crane | Q06 | Q06 | Q06 | Q06 | Q06 | Q06 | 6 | 103.87 | |||||||
| Lane | 2 | 2 | 2 | 2 | 2 | 2 | ||||||||||||
| Location | 100304 | 100306 | 100308 | 100404 | 100406 | 100408 | ||||||||||||
| Step1 | 8.28 | 9.32 | 7.69 | 7 | 9.16 | 7.97 | 8.13 | |||||||||||
| Step2 | 14.34 | 20.34 | 18.77 | 14.65 | 13.04 | 23.93 | 16.71 | |||||||||||
| Step3 | 15.44 | 15.21 | 15.98 | 16.96 | 16.09 | 17.6 | 16.04 | |||||||||||
| Step4 | 21.26 | 15.5 | 26.78 | 32.6 | 22.48 | 24.7 | 23.59 | |||||||||||
| Step5 | 25.8 | 21.22 | 12.26 | 24.53 | 16.49 | 16.04 | 18.86 | |||||||||||
| Step6 | 21.07 | 19.95 | 18.28 | 20.32 | 20.91 | 20.38 | 20.35 | |||||||||||
| Total Cycle Time | 106.19 | 101.54 | 99.76 | 116.06 | 98.17 | 110.62 | 103.9 | |||||||||||
| 7 | Gabriel | 12/27/2023 | Crane | QC06 | QC06 | QC06 | QC06 | QC06 | QC06 | QC06 | QC06 | 8 | 93.13 | |||||
| Lane | 2 | 2 | 2 | 2 | 2 | 2 | 2 | 2 | ||||||||||
| Location | 380106 | 380506 | 380606 | 380206 | 380306 | 380406 | 380706 | 380806 | ||||||||||
| Step1 | 13.07 | 7.46 | 8.36 | 7.72 | 8.61 | 8.52 | 9.51 | 7.76 | 8.44 | |||||||||
| Step2 | 13.71 | 11.24 | 12.47 | 30.01 | 11.74 | 11.24 | 12.43 | 14.01 | 12.45 | |||||||||
| Step3 | 16.12 | 18.52 | 16.15 | 16.23 | 16.26 | 15.86 | 15.95 | 35.84 | 16.19 | |||||||||
| Step4 | 15.24 | 15.36 | 21.51 | 12.91 | 11.26 | 13.31 | 26.06 | 14.44 | 14.84 | |||||||||
| Step5 | 14.65 | 12.87 | 13.25 | 13.87 | 13.91 | 12.92 | 26.5 | 12.15 | 13.56 | |||||||||
| Step6 | 17.84 | 20.64 | 23.88 | 19.51 | 21.99 | 19.2 | 19.69 | 14.16 | 19.60 | |||||||||
| Total Cycle Time | 90.63 | 86.09 | 95.62 | 100.25 | 83.77 | 81.05 | 110.14 | 98.36 | 93.13 |