Scatter Chart & Bar Chart

eoinymc

Board Regular
Joined
Jan 29, 2009
Messages
203
Hi,

I want to amalgamate a scatter chart and a bar chart.

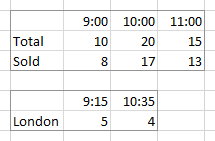
I have the following data

09:0009:1510:0010:3511:00
London54
Total102015
Sold81713

<tbody>
</tbody>

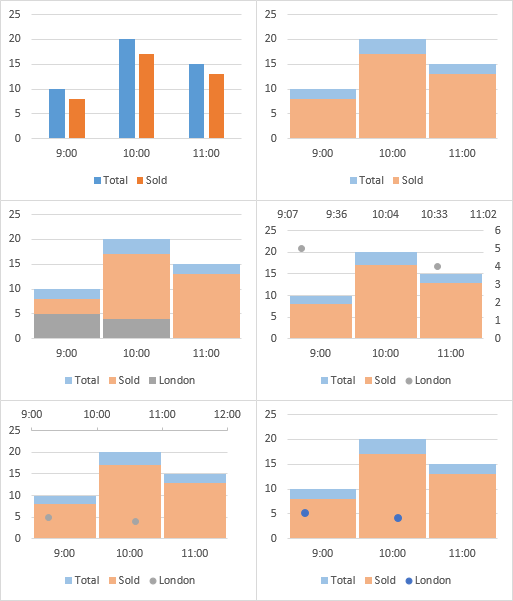
So basically, I want to see the following two graphs amalgamated...pictures attached... (View image: Total Sold & View image: London)

I was trying to do it on secondary axis on a scatter graph, but it just pushed all the data to one side for the primary axis and all the data to the other side for the secondary axis...anyone got any ideas?

Thanks,

Eoin

lr1kei23f

d1iuuvkxp
 

Excel Facts

How to calculate loan payments in Excel?
Use the PMT function: =PMT(5%/12,60,-25000) is for a $25,000 loan, 5% annual interest, 60 month loan.
Hi,


Excel 2013
ABCDEF
19:009:1510:0010:3511:00
2London54
3Total102015
4Sold81713
eoinymc


it might not look exactly the same as your Horizontal axis should contain the following 9:00, 9:15, 10:00, 10:35 and 11:00.
given so the range for the horizontal axis is =Sheet1!$B$1:$F$1
Series Total is =Sheet1!$B$3:$F$3
Series Sold is =Sheet1!$B$4:$F$4
Series London is =Sheet1!$B$2:$F$2
Chart type is at first a Clustered Column chart (sold and Total) then once London is added change the type to Combo and set london as Stacked Line with Marker and set line color to 'no line'.
Adjust Plot series Overlap to 0% and Gap Width to 0%.
 
Upvote 0
Thanks, but that's not exactly what I want...I want to only see hours at the bottom,

i.e. 09:00, 10:00, 11:00

and then have the total and sales with zero gap, but see the London part at 09:15, i.e. in between 09:00 & 10:00...

Does that make sense? So literally, put the first chart on top of the second chart in my initial pictures.

Thanks,

Eoin
 
Upvote 0
You need to use two different data ranges, one for the column chart, one for the XY scatter points.

TimeColumnXYData.png


Select the first range, insert a column chart (top left). Format the columns with a lighter fill so the added points will be easily visible, overlap 100%, gap width 5% (top right). You had 0% in your example, but I put in a small gap so the hours are more easily seen.

Select and copy the second data range, select the chart, use Paste Special to add the data as new series, series data in rows, series name in first column, category labels (X values) in first row. Excel adds this as a new column chart series (middle left).

Right click the new series, select Series Chart Type from the pop up menu, then select the XY Scatter type (middle right). Excel plots this series on the secondary axes.

Delete the secondary (right hand side) vertical axis, format the secondary (top) horizontal axis so the minimum is 0.375 (9/24, which is 9:00 am), maximum is 0.5 (12/24, or 12:00 noon), and major unit is 0.04166666 (1/24, or 1 hour) (bottom left).

Hide the top axis (don't delete it!) by setting axis tick labels to None and line color to None. Format the XY points so they appear clearly (bottom right).

TimeColumnXYCharts.png
 
Upvote 0
Absolutely perfect, I appreciate your explanation and the thoroughness of it!

Brilliant!
 
Upvote 0

Forum statistics

Threads
1,215,020
Messages
6,122,709
Members
449,093
Latest member
Mnur

We've detected that you are using an adblocker.

We have a great community of people providing Excel help here, but the hosting costs are enormous. You can help keep this site running by allowing ads on MrExcel.com.
Allow Ads at MrExcel

Which adblocker are you using?

Disable AdBlock

Follow these easy steps to disable AdBlock

1)Click on the icon in the browser’s toolbar.
2)Click on the icon in the browser’s toolbar.
2)Click on the "Pause on this site" option.
Go back

Disable AdBlock Plus

Follow these easy steps to disable AdBlock Plus

1)Click on the icon in the browser’s toolbar.
2)Click on the toggle to disable it for "mrexcel.com".
Go back

Disable uBlock Origin

Follow these easy steps to disable uBlock Origin

1)Click on the icon in the browser’s toolbar.
2)Click on the "Power" button.
3)Click on the "Refresh" button.
Go back

Disable uBlock

Follow these easy steps to disable uBlock

1)Click on the icon in the browser’s toolbar.
2)Click on the "Power" button.
3)Click on the "Refresh" button.
Go back
Back
Top