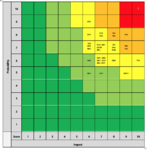
Scatter graph help!

hannansd

New Member
Joined
Oct 16, 2020
Messages
1
Office Version
  1. 2010
Platform
  1. MacOS
Hi,

I need to create a graph like in the image attached. I have attempted to use a scatter graph with the data and I imagine the rest is just formatting which I need to do. Can anyone help?
 

Attachments

  • Screenshot 2020-10-16 at 12.57.36.png
    Screenshot 2020-10-16 at 12.57.36.png
    90.7 KB · Views: 10

Excel Facts

Repeat Last Command
Pressing F4 adds dollar signs when editing a formula. When not editing, F4 repeats last command.

Forum statistics

Threads
1,216,110
Messages
6,128,894
Members
449,477
Latest member
panjongshing

We've detected that you are using an adblocker.

We have a great community of people providing Excel help here, but the hosting costs are enormous. You can help keep this site running by allowing ads on MrExcel.com.
Allow Ads at MrExcel

Which adblocker are you using?

Disable AdBlock

Follow these easy steps to disable AdBlock

1)Click on the icon in the browser’s toolbar.
2)Click on the icon in the browser’s toolbar.
2)Click on the "Pause on this site" option.
Go back

Disable AdBlock Plus

Follow these easy steps to disable AdBlock Plus

1)Click on the icon in the browser’s toolbar.
2)Click on the toggle to disable it for "mrexcel.com".
Go back

Disable uBlock Origin

Follow these easy steps to disable uBlock Origin

1)Click on the icon in the browser’s toolbar.
2)Click on the "Power" button.
3)Click on the "Refresh" button.
Go back

Disable uBlock

Follow these easy steps to disable uBlock

1)Click on the icon in the browser’s toolbar.
2)Click on the "Power" button.
3)Click on the "Refresh" button.
Go back
Back
Top