Using Non Linear Regression to predict missing values

danodco

New Member
Joined
Apr 5, 2022
Messages
4
Office Version
  1. 365
Platform
  1. Windows
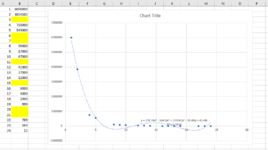
I would like to use excel to predict missing values in a table based on a best fit curve. I suspect non-linear regression analysis is a good way to do this but i am not a statistician and welcome solutions. I have a table of more than 300000 rows but I am posting a small excel sheet with 25 rows just to show what it is that I want to do. Cells in yellow are what I want to fill up.
 

Attachments

  • Capture.PNG
    Capture.PNG
    30.2 KB · Views: 35

Excel Facts

Will the fill handle fill 1, 2, 3?
Yes! Type 1 in a cell. Hold down Ctrl while you drag the fill handle.
Welcome to the Board! Before you move forward with some type of interpolation to estimate the points, it would be important to think about what the data represent and whether there is some theory or mathematical model to which the data would be expected to conform. Then you could perform an analysis to determine the "best fit" parameters that come close to matching the data to the model, and use those newly found fitting parameters to estimate the missing points. Do you have any idea about what a suitable model might be? I ask because the points you've shown do not appear to be suitable for a 4th order polynomial. I would guess an inverse logarithmic function, but knowing more about the data would be crucial.
 
Upvote 0
Hi KRice, thanks for the reply.
The purpose of this analysis is to analyze a google search results data set and interpolate the monthly search for a specific phrase.

E.g.
Search rank (1) - iphone charger would have 6million search results per month whereas search rack (24) - audio cassette would have only 12 per month.

The data is patchy by the generally pattern is that the higher the search rank, there is an exponential increase in number if searches.

Hope it makes sense.
The lower* the search rank, there is an exponential increase in search volume. The dataset i am working with has over a million search phrases.
 
Upvote 0
That makes sense. I think you hinted at the general type of model to investigate---something with exponential behavior. Here is a basic exponential model produced by Excel's trendline. Not bad...but maybe there is room for improvement. It might make sense to perform this analysis in a different package (like R) where other models can be created and various goodness of fit measures could be determined to make an assessment of the model form that seems to come closest to representing the data. I'll give this some thought and post back if I make any progress.

Another idea is to use an interpolating function, but I'll have to review some material to see if that might be a more suitable approach.
MrExcel_20220401.xlsx
ABC
1RankSearchesEst. by Model
2160000004616923
3238545822917066
431843062
547500001164484
65549000735745
76464859
87293707
9899000185570
10987000117247
11106700074079
121146805
13124100029572
14133700018684
15141200011805
16157459
171660004713
181740002977
191820001881
20199991189
2120751
2221474
2322789300
2423569189
252412120
Sheet10
Cell Formulas
RangeFormula
C2:C25C2=$F$1*EXP($F$2*A2)

MrExcel_20220401.xlsx
EF
1a7307333.012
2b-0.45915
3Rank, x
4N Searches, y
5functiony = a * exp(b*x)
Sheet10

1649143613559.png
 
Upvote 0
I'm back with a follow-up question. When you said...
I would like to use excel to predict missing values in a table based on a best fit curve.
Do you want/need a best fit curve for the entire set of data, or is the main objective to fill in missing points with reasonable estimates, perhaps without a "best fit curve"? I ask because the former involves looking at all of the data to establish that some function reasonably describes the known points, while the latter can be done by looking at a relatively small number of points around each gap and using a fitting-interpolating function to provide estimates for the missing points. The former involves development of a function that works over the entire range covered by the data, while the latter does not produce such a function, only discrete point estimates for the gaps.
 
Upvote 0
I'm back with a follow-up question. When you said...

Do you want/need a best fit curve for the entire set of data, or is the main objective to fill in missing points with reasonable estimates, perhaps without a "best fit curve"? I ask because the former involves looking at all of the data to establish that some function reasonably describes the known points, while the latter can be done by looking at a relatively small number of points around each gap and using a fitting-interpolating function to provide estimates for the missing points. The former involves development of a function that works over the entire range covered by the data, while the latter does not produce such a function, only discrete point estimates for the gaps.
Hi Krice,

The second option looks like what I need.
 
Upvote 0
I wanted to follow up with you. Did you get this resolved? In your first post, where you mentioned a file with 300000 rows, does that mean you have search term rankings from 1 to approximately 300000, but you are missing the number of searches for some of them? In my previous post, I was originally thinking about using a conventional cubic spline interpolating polynomial, although with a very large data set that method would almost necessarily involve splitting up the data into manageable chunks, as the size of the matrix involved in determining the interpolating polynomials would exceed limits in most software packages. I have a simpler approach if you are satisfied that the general form of your data follow the shape given by the exponential model in post #5. The simplified version does not examine the entire data set, but only the immediate known points above and below the gap...and the model parameters "a" and "b" are determined for the curve that includes those two known data points. Then your missing "gap" point(s) are determined using the "a" and "b" for this local curve.
MrExcel_20220401.xlsx
ABCDEFGH
1
2GivenOption 1 Est. by Full Set ModelOption 2 Est by Local Data Model
3RankSearches
41600000046169236000000Option 1: Guess a functional model for
52385458229170663854582fitting entire set of points
6318430621700275Try function:y = a * exp(b*x)
747500001164484750000where x is Rank, and y is number of Searches
85549000735745549000Excel's Trendline tool gives fitting parameters:
96464859310165a7307333.012
107293707175232b-0.45915
1189900018557099000
1298700011724787000Option 2: Use the general form of a guessed function model and
1310670007407967000establish "a" and "b" fitting parameters locally around gaps.
14114680552412
1512410002957241000
1613370001868437000
1714120001180512000
181574598485
1916600047136000
2017400029774000
2118200018812000
22199991189999
2320751923
2421474854
2522789300789
2623569189569
27241212012
Sheet10 (3)
Cell Formulas
RangeFormula
C4:C27C4=$L$9*EXP($L$10*A4)
D4:D27D4=IF(B4<>"",B4,LET(knownX1,INDEX(A$4:A4,XMATCH(1,--(B$4:B4<>""),0,-1)),knownY1,INDEX(B$4:B4,XMATCH(1,--(B$4:B4<>""),0,-1)),knownX3,INDEX(A4:A$300000,XMATCH(1,--(B4:B$300000<>""),0,1)),knownY3,INDEX(B4:B$300000,XMATCH(1,--(B4:B$300000<>""),0,1)),knownX2,A4,b,LN(knownY3/knownY1)/(knownX3-knownX1),a,knownY1/EXP(b*knownX1),a*EXP(b*knownX2)))

The known points are blue circles. Those returned by the Option 2 formula are open red circles. The Option 1 full data set trendline is shown as a dotted blue curve. You'll see that consideration of the entire full curve (the blue trendline) can lead to substantial errors relative to known points. For that reason, it would be prudent to avoid that approach. However, the general character of the data produce a shape similar to that of the exponential model used for the trendline. That helps to establish some confidence that forcing this same function through known data points immediately above and below the gaps (i.e., determining the local "a" and "b" parameters for this splicing curve) should offer reasonable estimates of the missing values.
1649956227581.png
 
Upvote 0

Forum statistics

Threads
1,215,006
Messages
6,122,665
Members
449,091
Latest member
peppernaut

We've detected that you are using an adblocker.

We have a great community of people providing Excel help here, but the hosting costs are enormous. You can help keep this site running by allowing ads on MrExcel.com.
Allow Ads at MrExcel

Which adblocker are you using?

Disable AdBlock

Follow these easy steps to disable AdBlock

1)Click on the icon in the browser’s toolbar.
2)Click on the icon in the browser’s toolbar.
2)Click on the "Pause on this site" option.
Go back

Disable AdBlock Plus

Follow these easy steps to disable AdBlock Plus

1)Click on the icon in the browser’s toolbar.
2)Click on the toggle to disable it for "mrexcel.com".
Go back

Disable uBlock Origin

Follow these easy steps to disable uBlock Origin

1)Click on the icon in the browser’s toolbar.
2)Click on the "Power" button.
3)Click on the "Refresh" button.
Go back

Disable uBlock

Follow these easy steps to disable uBlock

1)Click on the icon in the browser’s toolbar.
2)Click on the "Power" button.
3)Click on the "Refresh" button.
Go back
Back
Top