VBA Select Data for graphing

excelda

New Member
Joined
Jun 27, 2012
Messages
43
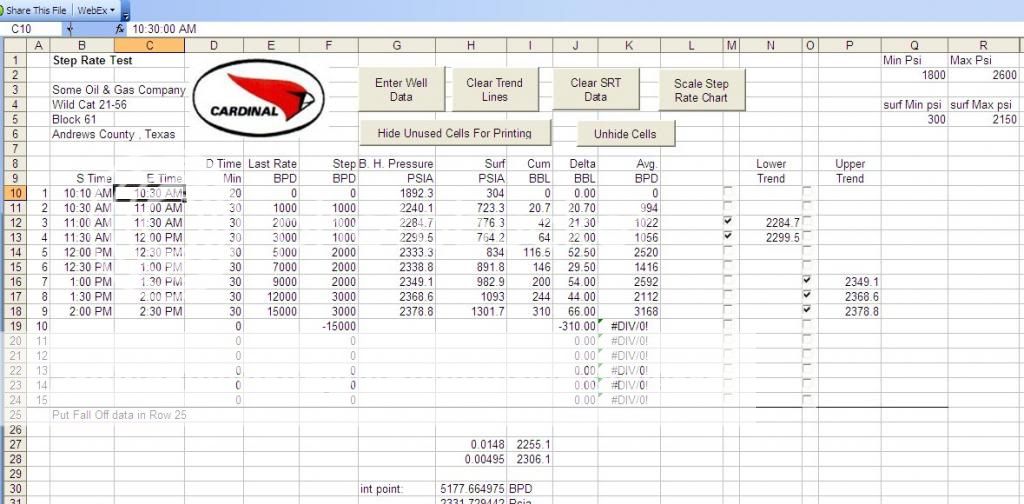
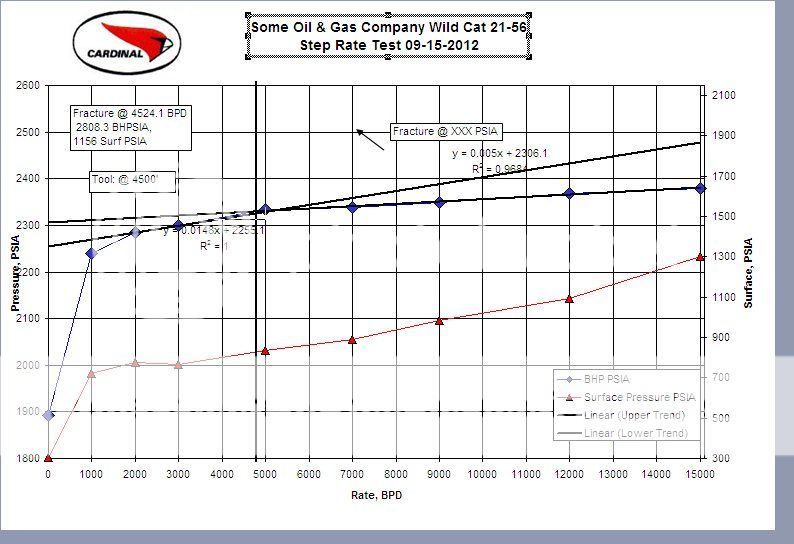
Hello everyone I have a spread sheet that we input data on and produce a simple graph. When I started we plotted these graphs by hand on chart paper. When we started using spread sheets I learned how to graph the problem is these guys we have working in the field don't know how or care to learn how to make a simple xy graph.
Six months ago I started automating a workbook so our field guys could just plug in numbers and have the needed graph, I put check boxes to select the points to calculate the slope and intercept. I hard coded to plot to say line 21 then at the end of the test we always have a zero point that we don't plot so I put that on line 22 then have a macro to hide everything before I print it.

I think I would like to dynamically select the data for graphing but I'm not sure about the best way to do this. My first thought is to key on the x axis column with a loop and graph data from zero until the x looses value. What do y'all think which would be the best approach?

I am sorry about the long post I hope I am clear with what I am trying to accomplish.
 

Excel Facts

How to total the visible cells?
From the first blank cell below a filtered data set, press Alt+=. Instead of SUM, you will get SUBTOTAL(9,)
Not real sure what your trying to do, where your data is, or what kind of chart you want. Here's some code that might get you started. In a blank wb, place data in sheet1 A1:B5 and call this sub (sheet1 code will do). HTH. Dave
Code:
Sub Chartdata()
Dim X1Value As Range, Y1Value As Range
Dim ChartRange As Range
Application.ScreenUpdating = False
'add new chart
'set new chart x values
Set X1Value = Sheets("Sheet1").Cells(1, 1)
'set new y values
Set Y1Value = Sheets("Sheet1").Cells(5, 2)
Set ChartRange = Sheets("Sheet1").Range(X1Value, Y1Value)
Charts.Add.Location Where:=xlLocationAsObject, Name:="Sheet1"
ActiveChart.ChartType = xlXYScatterLinesNoMarkers
ActiveChart.SetSourceData Source:=ChartRange, PlotBy:=xlColumns
Application.ScreenUpdating = True
End Sub
 
Upvote 0
ND thank you.

I have added a screen shot of the page they type data in and the chart. We use the same workbook over and over. As the field guys finish each step they plot the Rate pumped which is the x axes and Bottom Hole Pressure which is on one y axes and Surface pressure which is on the secondary axes. At the end of the job it will always have a zero point back in the BPD column which I do not want to plot. So how do I loop through the data sheet adding the data to the graph until it sees the zero rate after the job. It may have 5 lines of data or 20 lines of data depending on what the well is doing.

Data Sheet:
data_zpsbb889796.jpg


Graph:
chart_zps297ba3de.jpg


The data and graph are about as simple as it can get hop it helps.

Thanks
 
Upvote 0
What columns are the data in? Please indicate the x and y column for each data series. There seems to be 4 series in the chart (2 "dummy" series of lines ie. "linear") Are the lines of data actually rows? Do you want to remake the whole chart each time or just change the data. Is this an embedded chart or a chart sheet? Dave
 
Upvote 0
ND thanks for taking the time to look at my chart.

Series 1 is Bottom Hole Pressure BHP
x axes = f
y axes = g

Series 2 is surface Pressure it is on a secondary axes
F= x axes
h= Y axes

Series 3 and 4 are my trend lines I use to calculate the Slope and intercept of series 1. They are controlled by the check box controls columns N & P.

We will pump a rate for 30 minutes then add that data for that step to the chart so I would like to just add the data each time and keep the chart and just change the data.
It is a chart sheet
 
Last edited:
Upvote 0
I started this chart about 6 or 7 months ago every couple of months I get a bright Ideal and think it would help the field guys to add this so I will spend some time working on it. I said earlier I have been working on it for six months when really I have worked on it properly 3 days total in the last six months.
It works now but finding little useful projects is the way I learn fastest. I am not even a good beginner programmer but I have made some cool, well to me functions that I use in excel during my daily life :).
 
Upvote 0
You only learn by doing. XL is kind of a precise thing when it comes to VBA. You need to know the full scope of what your doing and exactly where the data is and exactly what the ouput should be BEFORE you start coding anything. The image you posted is very helpful but what is f19... is it part of the data... and where is the zero indicator? Hide and print? Why not save it to file as a .gif or .jpeg that you can print later (or save some trees and not print it unless you need it.) Dave
 
Upvote 0
NdNovice F19 is data we collect but it is not plotted I am plotting Bhp, Surf psi, Rate is x axes then i plot the slope and intercept off of the trend lines on N & P.
 
Upvote 0
Not exactly sure what you want just yet. This code will remove the existing series from the chart and add the new data to the chart (well for 2 of the series anyways.) HTH. Dave
 
Upvote 0
Not exactly sure what you want just yet. This code will remove the existing series from the chart and add the new data to the chart (well for 2 of the series anyways.) HTH. Dave
Code:
Sub Chartdata()
Dim LastRow As Integer
Application.ScreenUpdating = False
'remove existing series
Sheets("Sheet1").ChartObjects(1).Chart.SeriesCollection(2).Delete
Sheets("Sheet1").ChartObjects(1).Chart.SeriesCollection(1).Delete
'Use "A" to get last row
With Sheets("Sheet1")
    LastRow = .Range("A" & .Rows.Count).End(xlUp).Row
End With
'add new series with new data
Sheets("Sheet1").ChartObjects(1).Chart.SeriesCollection.Add _
  Source:=Sheets("Sheet1").Range("sheet1!f10:g" & LastRow), Rowcol:=xlColumns
Sheets("Sheet1").ChartObjects(1).Chart.SeriesCollection.Add _
 Source:=Sheets("Sheet1").Range("sheet1!h10:h" & LastRow), Rowcol:=xlColumns
Application.ScreenUpdating = True
End Sub
 
Upvote 0

Forum statistics

Threads
1,215,460
Messages
6,124,949
Members
449,198
Latest member
MhammadishaqKhan

We've detected that you are using an adblocker.

We have a great community of people providing Excel help here, but the hosting costs are enormous. You can help keep this site running by allowing ads on MrExcel.com.
Allow Ads at MrExcel

Which adblocker are you using?

Disable AdBlock

Follow these easy steps to disable AdBlock

1)Click on the icon in the browser’s toolbar.
2)Click on the icon in the browser’s toolbar.
2)Click on the "Pause on this site" option.
Go back

Disable AdBlock Plus

Follow these easy steps to disable AdBlock Plus

1)Click on the icon in the browser’s toolbar.
2)Click on the toggle to disable it for "mrexcel.com".
Go back

Disable uBlock Origin

Follow these easy steps to disable uBlock Origin

1)Click on the icon in the browser’s toolbar.
2)Click on the "Power" button.
3)Click on the "Refresh" button.
Go back

Disable uBlock

Follow these easy steps to disable uBlock

1)Click on the icon in the browser’s toolbar.
2)Click on the "Power" button.
3)Click on the "Refresh" button.
Go back
Back
Top