VBA - Bar Chart Values

DomoKing

New Member
Joined
Jan 31, 2018
Messages
7
Hi everyone, so I have a bar chart that is date (x-axis) by hours (y-axis), and for each date there are two bars (based on data from Column C and Column D). So I want to make it so that the chart automatically updates everytime I enter a new set of data for column C and D, and everytime the new set of bars appear in the chart they have values on top of them. So if I have 5 set of data (C1:C5, and D1:D5), only C5 and D5 bars have values on them. And if there is C6 and D6 then the values on C5 and D5 bars will disappear and instead the C6 and D6 bars will have values on them in the chart. Finally if the value for any bar is 0, then no value will be shown on that bar. Any insight on how to make macro for this? Thanks a ton!
 

Excel Facts

Spell Check in Excel
Press F7 to start spell check in Excel. Be careful, by default, Excel does not check Capitalized Werds (whoops)
Re: Urgent VBA help! Bar Chart Values

do a web search for Peltier and charts (lots of help there), what you might consider is creating a bigger range for values, and modelling the chart on that and just hide the cells from the range until you are ready to use them
 
Upvote 0
We'll set your data up in a table, which is a special data structure that lets other objects that link to it expand as you add data.

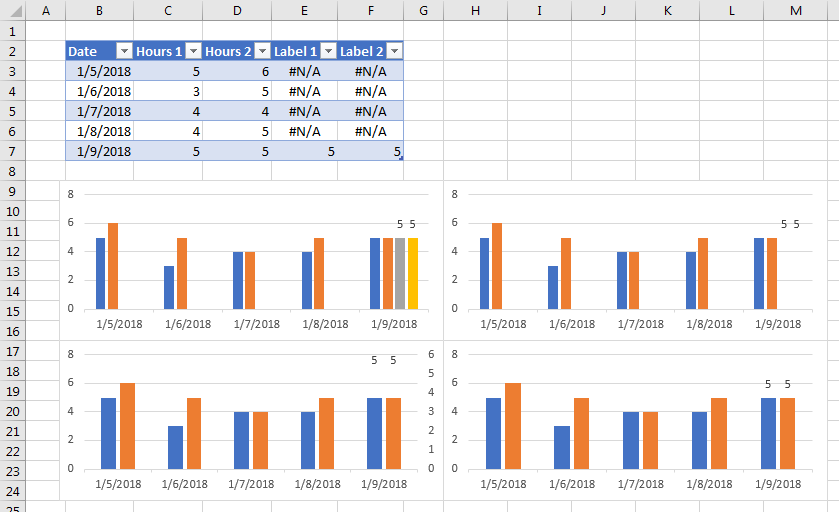
The table is shown below. Column B has the dates, columns C and D have the values you are plotting, columns E and F contain data we'll use for our labels.

Column E has the formula

=IF(ROW()=ROW([Date])+ROWS([Date])-1,[@[Hours 1]],NA())

Column F has the similar formula

=IF(ROW()=ROW([Date])+ROWS([Date])-1,[@[Hours 2]],NA())

The funny notation with brackets is table structured referencing, which Excel should generate as you write the formulas. If not, you can just base your formulas on what I have here. [Date] refers to the whole column of values in the Date column. [@[Hours 1]] refers to the cell in the Hours 1 column that is in the same row as the cell with the formula.

These formulas put #N/A into all cells of columns E and F except the last row, which contain the same values from columns C and D. #N/A is another piece of magic, in that is is not plotted, and will not be encumbered with a stray data label. We're going to plot all the data in our (vertical) bar chart, put data labels only on the column E and F bars, but hide the E and F bars.

The top left chart below shows all of the data plotted, and data labels on the last two series. The top right chart shows the column E and F bars hidden, by formatting them with no fill.

In the bottom left chart I've moved the column E and F bars to the secondary axis, so they line up with the column C and D bars. the labels are too high, though, because the primary and secondary axes have different scales. In the bottom right chart I've fixed that by deleting the secondary vertical axis.

mMex3Hr.png


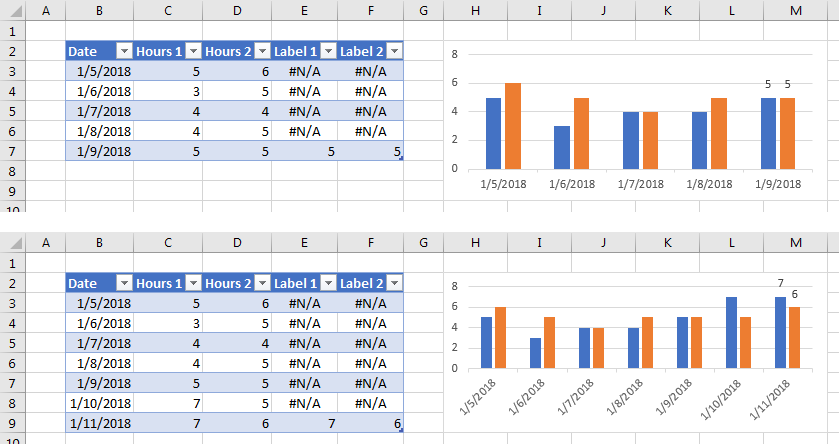
Now we'll see the magic of Tables for making a dynamic chart.

The first view below shows the original five-row data range and corresponding chart.

The second view shows the table expanded by a couple rows. The cells in columns E and F with values are now in the new last row. The chart has expanded to include the new dates, and the data labels are still over the last bars in the chart.

7VeF5om.png
 
Upvote 0
Hi Jon,

When I drag the formulas cells in Column E and F down they always show N/A, how do I fix this? Thanks.
 
Upvote 0
Thanks for the post, very informative, this is partly what I am trying to achieve too in another thread here.
Another member of this forum "thisoldman" pointed me to your post here as a possible venue for me to learn and partially solve similar challenge, which is still outstanding.
Link: https://www.mrexcel.com/forum/excel...outside-designated-ref-range.html#post4999961

Regards,
KashBG

ThisOldMan did a fine job I thought of answering your question, so I didn't add my own answer.
 
Upvote 0
When I drag the formulas cells in Column E and F down they always show N/A, how do I fix this?

When I drag them down, the last row always links to the cells in the previous rows, and everything about the last row is #N/A.

Make sure the formulas are correct all the way down.
 
Upvote 0

Forum statistics

Threads
1,215,377
Messages
6,124,598
Members
449,174
Latest member
chandan4057

We've detected that you are using an adblocker.

We have a great community of people providing Excel help here, but the hosting costs are enormous. You can help keep this site running by allowing ads on MrExcel.com.
Allow Ads at MrExcel

Which adblocker are you using?

Disable AdBlock

Follow these easy steps to disable AdBlock

1)Click on the icon in the browser’s toolbar.
2)Click on the icon in the browser’s toolbar.
2)Click on the "Pause on this site" option.
Go back

Disable AdBlock Plus

Follow these easy steps to disable AdBlock Plus

1)Click on the icon in the browser’s toolbar.
2)Click on the toggle to disable it for "mrexcel.com".
Go back

Disable uBlock Origin

Follow these easy steps to disable uBlock Origin

1)Click on the icon in the browser’s toolbar.
2)Click on the "Power" button.
3)Click on the "Refresh" button.
Go back

Disable uBlock

Follow these easy steps to disable uBlock

1)Click on the icon in the browser’s toolbar.
2)Click on the "Power" button.
3)Click on the "Refresh" button.
Go back
Back
Top