I have been watching your U-Tube regarding the creation of pivot table and dashboards and I followed your written materials and am having some problems creating the pivot table from the get go. So, will you be kind and please shed some light and offer some suggestions as to why I am not getting the correct format of Date. I really appreciate your help and thanks for your cooperation's.
This is extremely a simple excel data and for some reason it doesn't display it correctly ;
THIS IS THE RAW DATA:
<tbody>
</tbody>
The Pivot Table:
<tbody>
</tbody>
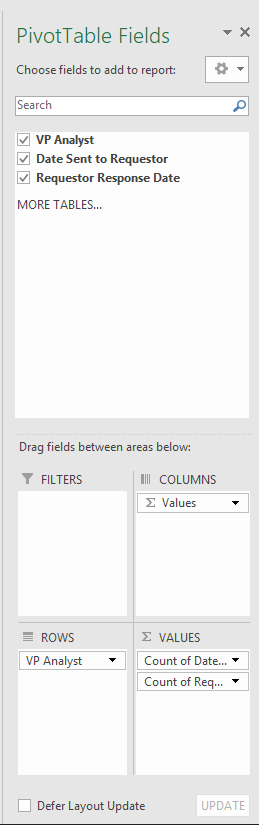
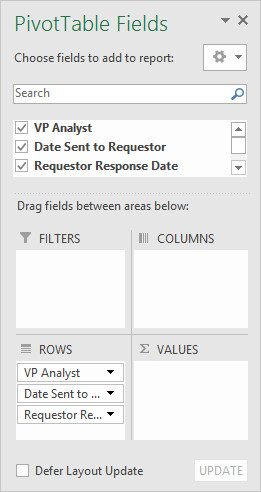
For some reason when I am trying to create the pivot table and move the appropriate columns and the final result shows no dates and instead comes up with number of Analysts and not showing the actual dates and then when I change the field to show dates through Format Cell, then I get the following:
<tbody>
</tbody>
This is extremely a simple excel data and for some reason it doesn't display it correctly ;
THIS IS THE RAW DATA:
| VP Analyst | Date Sent to Requestor | Requestor Response Date |
| Brian | 04/29/19 | 04/30/19 |
| Brian | 04/29/19 | 04/30/19 |
| Brian | 04/29/19 | 04/30/19 |
| Ruthie | 05/09/19 | 05/09/19 |
| Scott | 05/09/19 | 05/09/19 |
<tbody>
</tbody>
The Pivot Table:
| Row Labels | Count of Date Sent to Requestor | Count of Requestor Response Date |
| Brian | 3 | 3 |
| Ruthie | 1 | 1 |
| Scott | 1 | 1 |
| Grand Total | 5 | 5 |
<tbody>
</tbody>
For some reason when I am trying to create the pivot table and move the appropriate columns and the final result shows no dates and instead comes up with number of Analysts and not showing the actual dates and then when I change the field to show dates through Format Cell, then I get the following:
| Row Labels | Count of Date Sent to Requestor | Count of Requestor Response Date |
| Brian | 01/03/00 | 1/3/00 |
| Ruthie | 01/01/00 | 1/1/00 |
| Scott | 01/01/00 | 1/1/00 |
| Grand Total | 01/05/00 | 1/5/00 |
<tbody>
</tbody>

") One other question I have if I add more data to my pivot table, can I later create a graphical dashboard (Line chart, Pie chart, etc.) to them and if so, should I just highlight the entire pivot table to creat these or there is another way that you can suggest?
One other question I have if I add more data to my pivot table, can I later create a graphical dashboard (Line chart, Pie chart, etc.) to them and if so, should I just highlight the entire pivot table to creat these or there is another way that you can suggest?


