Add New Variable to Shapes

Doflamingo

Board Regular
Joined
Apr 16, 2019
Messages
238
Hi all,

Here is the code to create a structure chart from range A to range C of the sheet ‘’BD’’

Here is a screenshot of the sheet ‘’BD’’
https://www.dropbox.com/s/vyik32v24dp2ysm/sheet BD.png?dl=0

There is the ‘’Big father‘’ in A2 which is the ‘’Boss’’

The column B states all the ‘’sub father’’ with their ‘’children’’ that are in the column A except for the value ‘’Boss’’

For example the ‘’Boss’’ in cell A2 is the father of ‘’Vice President’’ in cell A3 that is the father of ‘’Employee13’’ in cell A11

The column C of the sheet ‘’BD’’ is the description of what you see inside the shapes in the sheet ‘’Shapes’’ where the structure chart is displayed once the macro is activated

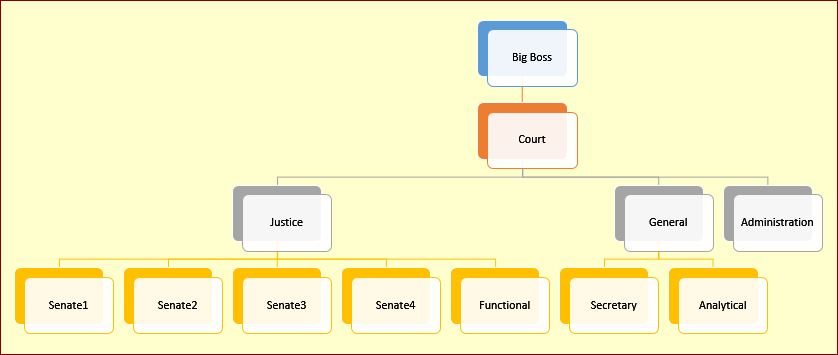
Here is a screenshot of the sheet ‘’Shapes’’ of what I have currently with the data of the sheet ''BD''

https://www.dropbox.com/s/9p4pm5ukdmyly8h/Sheet Shapes.png?dl=0

Here is the code I have to display the structure chart in the sheet ''Shapes''

Code:
Sub créeShape(parent, niv, Attribut, coul) ' procédure récursive
  hauteurshape = 48
  largeurshape = 85
  colonne = colonne + 1
  forga.Shapes.AddShape(msoShapeFlowchartAlternateProcess, 10, 10, largeurshape, hauteurshape).Name = parent
  forga.Shapes(parent).Line.ForeColor.SchemeColor = 1
  txt = parent & vbLf & Attribut
  With forga.Shapes(parent)
    .TextFrame.Characters.Text = txt
    .TextFrame.Characters(Start:=1, Length:=1000).Font.Size = 8
    .TextFrame.Characters(Start:=1, Length:=1000).Font.ColorIndex = 0
    .TextFrame.Characters(Start:=1, Length:=Len(parent)).Font.Bold = True
    .TextFrame.Characters(Start:=1, Length:=Len(parent)).Font.ColorIndex = 3
    .Fill.ForeColor.RGB = coul
  End With
  forga.Shapes(parent).Left = débutOrg.Left + inth * colonne
  forga.Shapes(parent).Top = débutOrg.Top + intv * (niv - 1)
  For i = 1 To n
    If Tbl(i, 1) = parent And niv > 1 Then
      shapePère = Tbl(i, 2)
      
      forga.Shapes.AddConnector(msoConnectorElbow, 100, 100, 100, 100).Name = parent & "c"
      
      forga.Shapes(parent & "c").Line.ForeColor.SchemeColor = 22
      forga.Shapes(parent & "c").ConnectorFormat.BeginConnect forga.Shapes(shapePère), 3
      forga.Shapes(parent & "c").ConnectorFormat.EndConnect forga.Shapes(parent), 1
      
   End If
   
   If Tbl(i, 2) = parent Then créeShape Tbl(i, 1), niv + 1, Tbl(i, 3), f.Cells(i + 1, 1).Interior.Color
  Next i
  
End Sub
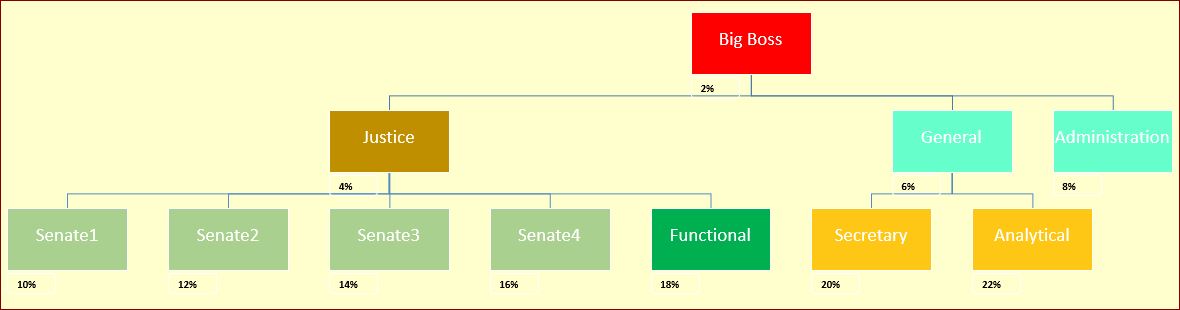
My problem is that I would like to expand my variables, I add a new range of variable in the column D of the sheet ‘’BD’’ and I would like that the specific variable be not included in the shapes like the variable of the column C are, but rather be below and at the left of the shapes they are related to.

Here a screenshot of what I would like to obtain
https://www.dropbox.com/s/emm9bkqm9eanmfm/goal.png?dl=0

I have changes the code above with the red lines that represent the values of the column D but that does not work

Code:
Sub créeShape(parent, niv, Attribut, coul) ' procédure récursive
  hauteurshape = 48
  largeurshape = 85
  colonne = colonne + 1
  forga.Shapes.AddShape(msoShapeFlowchartAlternateProcess, 10, 10, largeurshape, hauteurshape).Name = parent
  forga.Shapes(parent).Line.ForeColor.SchemeColor = 1
  txt = parent & vbLf & Attribut
  With forga.Shapes(parent)
    .TextFrame.Characters.Text = txt
    .TextFrame.Characters(Start:=1, Length:=1000).Font.Size = 8
    .TextFrame.Characters(Start:=1, Length:=1000).Font.ColorIndex = 0
    .TextFrame.Characters(Start:=1, Length:=Len(parent)).Font.Bold = True
    .TextFrame.Characters(Start:=1, Length:=Len(parent)).Font.ColorIndex = 3
    .Fill.ForeColor.RGB = coul
  End With
  forga.Shapes(parent).Left = débutOrg.Left + inth * colonne
  forga.Shapes(parent).Top = débutOrg.Top + intv * (niv - 1)
  For i = 1 To n
    If Tbl(i, 1) = parent And niv > 1 Then
      shapePère = Tbl(i, 2)
      
      forga.Shapes.AddConnector(msoConnectorElbow, 100, 100, 100, 100).Name = parent & "c"
      
      forga.Shapes(parent & "c").Line.ForeColor.SchemeColor = 22
      forga.Shapes(parent & "c").ConnectorFormat.BeginConnect forga.Shapes(shapePère), 3
      forga.Shapes(parent & "c").ConnectorFormat.EndConnect forga.Shapes(parent), 1
      
   End If
   
   If Tbl(i, 2) = parent Then créeShape Tbl(i, 1), niv + 1, Tbl(i, 3), f.Cells(i + 1, 1).Interior.Color
  Next i
  
[COLOR=#ff0000]  For u = 1 To n[/COLOR]
[COLOR=#ff0000]    If Tbl(u, 1) = parent And niv > 1 Then[/COLOR]
[COLOR=#ff0000]      shapePère = Tbl(u, 2)[/COLOR]
[COLOR=#ff0000]      [/COLOR]
[COLOR=#ff0000]      forga.Shapes.AddConnector(msoConnectorElbow, 100, 100, 100, 100).Name = parent & "d"[/COLOR]
[COLOR=#ff0000]      [/COLOR]
[COLOR=#ff0000]      forga.Shapes(parent & "d").Line.ForeColor.SchemeColor = 22[/COLOR]
[COLOR=#ff0000]      forga.Shapes(parent & "d").ConnectorFormat.BeginConnect forga.Shapes(shapePère), 3[/COLOR]
[COLOR=#ff0000]      forga.Shapes(parent & "d").ConnectorFormat.EndConnect forga.Shapes(parent), 1[/COLOR]
[COLOR=#ff0000]      [/COLOR]
[COLOR=#ff0000]   End If[/COLOR]
[COLOR=#ff0000]   [/COLOR]
[COLOR=#ff0000]   If Tbl(u, 2) = parent Then créeShape Tbl(u, 1), niv + 1, Tbl(u, 3), f.Cells(u + 1, 1).Interior.Color[/COLOR]
[COLOR=#ff0000]  Next u[/COLOR]
  
  
End Sub


Any idea ?
 
Hello @Worf
Many thanks for your reply
Indeed, you’re right, it’s a better idea to keep working on the format of the 1st chart before we approach the 2nd chart
Many thanks for the warning, indeed I noticed that the code put data in the sheet ‘’data1’’ in the columns F, G, H, I while it was before in the sheet ‘’test1’’
I begin to understand your logic with the data put in the column L, M, N with the top level of each shapes and the number of shapes at that level
I’m eager to read some news about you next week
Many thanks again for your time and your help on that big issue
Kind regards
 
Upvote 0

Excel Facts

Links? Where??
If Excel says you have links but you can't find them, go to Formulas, Name Manager. Look for old links to dead workbooks & delete.
I found code that automatically produces the smart art below, do you like it?

yCMzfsj.jpg
 
Upvote 0
Hello @Worf

The main structure seems very great! It's a very good job :)

I really like it, but I prefered when the variables of the column D where previously displayed below and at the left of each shapes and also when there was no shadow behind the shapes.

I kept working on it, here see the screenshot

https://www.dropbox.com/s/gnh1fb2hqiz1zpf/new.png?dl=0

and here the data

https://www.dropbox.com/s/06mrdt1h5zatsrg/data.png?dl=0

It's very bad..., I kept coding and I got that result but I do prefer the chart you propose.
 
Upvote 0
  • The shadows can be removed. I want to use the smart art engine because producing a well-arranged organizational chart is not trivial and it does the job.
  • Likewise, my code will place the extra information below each shape.
  • Do you want to automatically color the shapes based on some criteria?
  • I will be back in a couple of days. The idea is to do it all with just one click.
 
Upvote 0
Hello @Worf
Many thanks for your reply
If Smartart on Excel is the best solutions, let’s try it.
Indeed I need to keep the extra information – data of column D- at the left and below of each shapes
No need of shadows behind the shapes, and I would like to keep the same number of data, entered in the column A, B, C and D where the values entered in the D column were located in the little shapes below/at the left of the big shapes.
I would like to keep the feature when a specific cell of the colum A had a peculiar color, the shape related had the same color. Except for the data of the colum D representing the little shapes, keep the feature ‘’no fill’’ and ‘’no outline’’
Yes the idea is to put the data in a sheet, and to get the chart displayed in just one click.

Many thanks for your help, I keep trying on the issue
 
Upvote 0
Here is what I have so far:

Excel Workbook
HIJKLM
69Input table
70
71SeqCode1Code2InfoBlankOrg
721U00O0A02JU00O0A02J0,02Big Boss
732U00O0A03EU00O0A02J0,04Justice
743U00O0A049U00O0A02J0,06General
754U00O0A054U00O0A02J0,08Administration
765U00O0A06ZU00O0A03E0,1Senate1
776U00O0A07UU00O0A03E0,12Senate2
787U00O0A08PU00O0A03E0,14Senate3
798U00O0A09KU00O0A03E0,16Senate4
809U00O0A0AFU00O0A03E0,18Functional
8110U00O0A0Q7U00O0A0490,2Secretary
8211U00O0A0SXU00O0A0490,22Analytical
invoice


oZCUFrV.jpg
 
Upvote 0
This is the code; next step will be converting your data table into the one this code wants.

Code:
Sub main()
CreateDiagram Sheets("object")
End Sub


Sub CreateDiagram(Source As Worksheet)
Dim oSALayout As SmartArtLayout, QNode As SmartArtNode, QNodes As SmartArtNodes, _
oshp As Shape, Line%, i%, r As Range, PID$, mn, mx, ws As Worksheet, dt As Worksheet, crar(), c%, ad
c = 1
ReDim crar(1 To c)
Set ws = Sheets("object"): Set dt = Sheets("invoice")
ws.Activate
ws.[a:f].ClearContents
dt.[h71].CurrentRegion.Copy ws.[a1]
For i = 1 To ws.Shapes.Count
    ws.Shapes(1).Delete
Next
Set oSALayout = Application.SmartArtLayouts(89) 'reference to organization chart
Set oshp = ws.Shapes.AddSmartArt(oSALayout)
Set QNodes = oshp.SmartArt.AllNodes
For i = 1 To 5
    oshp.SmartArt.AllNodes(1).Delete        ' initial nodes
Next
Line = 2                                     ' look for roots
Do While Source.Cells(Line, 1) <> ""
    If Source.Cells(Line, 2) = Source.Cells(Line, 3) Then
        Set QNode = oshp.SmartArt.AllNodes.Add
        QNode.TextFrame2.TextRange.Text = Source.Cells(Line, 6)
        PID = Source.Cells(Line, 2)         ' parent node
        Source.Rows(Line).Delete
        AddChildNodes QNode, Source, PID
    Else
        Line = Line + 1
    End If
Loop
oshp.SmartArt.AllNodes(1).TextFrame2.TextRange.Text = dt.[m72]
oshp.Width = 1000
oshp.Height = 700
oshp.Select
CommandBars.ExecuteMso ("SmartArtConvertToShapes")
Selection.Ungroup
Set r = ws.[a2]
On Error Resume Next
For i = 1 To ws.Shapes.Count
    r = ws.Shapes(i).Height
    Set r = r.Offset(1)
Next
mn = WorksheetFunction.Min([a:a])
mx = WorksheetFunction.Max([a:a])
For i = ws.Shapes.Count To 1 Step -1
    If ws.Shapes(i).Height = mn Then ws.Shapes(i).Delete
    If ws.Shapes(i).Height = mx Then
        crar(c) = ws.Shapes(i).Name
        c = c + 1
        ReDim Preserve crar(1 To c)
    End If
Next
On Error GoTo 0
For i = LBound(crar) To UBound(crar)
    If Len(crar(i)) Then
        Set r = dt.Range("m:m").Find(ws.Shapes(crar(i)).TextFrame2.TextRange.Text, dt.[m1], xlValues, 1)
        ad = r.Offset(, -2)
        ws.Shapes(crar(i)).Fill.ForeColor.RGB = r.Interior.Color
        ws.Shapes.AddShape(62, 10, 10, ws.Shapes(crar(i)).Width / 2.5, ws.Shapes(crar(i)).Height / 3).Name = _
        ws.Shapes(crar(i)).Name & "aux"
        With ws.Shapes(ws.Shapes(crar(i)).Name & "aux")
            .Left = ws.Shapes(crar(i)).Left
            .Top = ws.Shapes(crar(i)).Top + ws.Shapes(crar(i)).Height + 2
            .Line.ForeColor.SchemeColor = 1
            .Fill.Visible = msoFalse
            .TextFrame.Characters.Text = FormatPercent(ad, 0, vbTrue, vbFalse, vbUseDefault)
            .TextFrame.Characters(1, Len(ad)).Font.Size = 9
            .TextFrame.Characters(1, Len(ad)).Font.ColorIndex = 0
            .TextFrame.Characters(1, Len(ad)).Font.Bold = 1
            If ad = 0 Then .TextFrame.Characters.Text = "0%"
        End With
    End If
Next
End Sub


Sub AddChildNodes(QNode As SmartArtNode, Source As Worksheet, PID$)
Dim Line%, Found As Boolean, ParNode As SmartArtNode, CurPid$
Line = 2
Found = False                           'nothing found yet
Do While Source.Cells(Line, 1) <> ""
    If Source.Cells(Line, 3) = PID Then
        Set ParNode = QNode
        Set QNode = QNode.AddNode(msoSmartArtNodeBelow)
        QNode.TextFrame2.TextRange.Text = Cells(Line, 6)
        CurPid = Source.Cells(Line, 2)  ' current parent node
        If Not Found Then Found = True  'something was found
        Source.Rows(Line).Delete
        AddChildNodes QNode, Source, CurPid
        Set QNode = ParNode
        ElseIf Found Then               'it's sorted, nothing else can be found
        Exit Do
    Else
        Line = Line + 1
    End If
Loop
End Sub
 
Upvote 0
Hello @Worf
I read your code and try to understand it, but until now I have found out this
I created a new workbook and I put the data in the sheet ’’invoice’’ at the same location than you. From the cell H71 to M82. When I run the macro ‘’main’’ it re-write the same data from sheet ‘’invoice’’ to the sheet ‘’object’’ from cell A1 to cell F12.
Then It creates also in the sheet ‘’object’’ an empty frame …
Currently it does not display the chart you posted …I though you wanted to keep focusing on the format of the first chart, the one that went from bottom to top before working on the other chart, the one you just posted that goes from top to bottom.
Unless I’m mistaken, it does not currently displays the chart you posted because like you wrote it the ‘’data table is not converted into the one this code wants’’. If I’m wrong, could you, please, post the workbook you used ?
Many thanks in advance
Kind regards
 
Upvote 0
  • I made a minor tweak to the code; the link to my test workbook is below. It produces the chart shown at the previous post.
  • An interesting way to study this code is to activate the debugger, execute it step by step and watch the chart be created. Ideally, on a dual monitor setup…
  • The core code I adapted starts from the top. After we get it working, I can prepare a version that starts from the bottom.
  • I suppose you want to keep your current data table, so I will convert it into the one shown above.

https://www.dropbox.com/s/natcmfvjnwusd1k/orga3.xlsm?dl=0

Code:
Sub CreateDiagram(Source As Worksheet)
Dim oSALayout As SmartArtLayout, QNode As SmartArtNode, QNodes As SmartArtNodes, _
oshp As Shape, Line%, i%, r As Range, PID$, mn, mx, ws As Worksheet, dt As Worksheet, crar(), c%, ad
c = 1
ReDim crar(1 To c)
Set ws = Sheets("object"): Set dt = Sheets("invoice")
ws.Activate
Application.ScreenUpdating = 1
ws.[a:f].ClearContents
dt.[h71].CurrentRegion.Copy ws.[a1]
For i = 1 To ws.Shapes.Count
    ws.Shapes(1).Delete
Next
Set oSALayout = Application.SmartArtLayouts(89) 'reference to organization chart
Set oshp = ws.Shapes.AddSmartArt(oSALayout)
[COLOR=#ff8c00]oshp.Top = [a25].Top[/COLOR]
[COLOR=#ff8c00]oshp.Left = [a25].Left[/COLOR]
Set QNodes = oshp.SmartArt.AllNodes
For i = 1 To 5
    oshp.SmartArt.AllNodes(1).Delete        ' initial nodes
Next
Line = 2                                     ' look for roots
Do While Source.Cells(Line, 1) <> ""
    If Source.Cells(Line, 2) = Source.Cells(Line, 3) Then
        Set QNode = oshp.SmartArt.AllNodes.Add
        QNode.TextFrame2.TextRange.Text = Source.Cells(Line, 6)
        PID = Source.Cells(Line, 2)         ' parent node
        Source.Rows(Line).Delete
        AddChildNodes QNode, Source, PID
    Else
        Line = Line + 1
    End If
Loop
oshp.SmartArt.AllNodes(1).TextFrame2.TextRange.Text = dt.[m72]
oshp.Width = 1000
oshp.Height = 700
oshp.Select
CommandBars.ExecuteMso ("SmartArtConvertToShapes")
Selection.Ungroup
Set r = ws.[a2]
On Error Resume Next
For i = 1 To ws.Shapes.Count
    r = ws.Shapes(i).Height
    Set r = r.Offset(1)
Next
mn = WorksheetFunction.Min([a:a])
mx = WorksheetFunction.Max([a:a])
For i = ws.Shapes.Count To 1 Step -1
    If ws.Shapes(i).Height = mn Then ws.Shapes(i).Delete
    If ws.Shapes(i).Height = mx Then
        crar(c) = ws.Shapes(i).Name
        c = c + 1
        ReDim Preserve crar(1 To c)
    End If
Next
On Error GoTo 0
For i = LBound(crar) To UBound(crar)
    If Len(crar(i)) Then
        Set r = dt.Range("m:m").Find(ws.Shapes(crar(i)).TextFrame2.TextRange.Text, dt.[m1], xlValues, 1)
        ad = r.Offset(, -2)
        ws.Shapes(crar(i)).Fill.ForeColor.RGB = r.Interior.Color
        ws.Shapes.AddShape(62, 10, 10, ws.Shapes(crar(i)).Width / 2.5, ws.Shapes(crar(i)).Height / 3).Name = _
        ws.Shapes(crar(i)).Name & "aux"
        With ws.Shapes(ws.Shapes(crar(i)).Name & "aux")
            .Left = ws.Shapes(crar(i)).Left
            .Top = ws.Shapes(crar(i)).Top + ws.Shapes(crar(i)).Height + 2
            .Line.ForeColor.SchemeColor = 1
            .Fill.Visible = msoFalse
            .TextFrame.Characters.Text = FormatPercent(ad, 0, vbTrue, vbFalse, vbUseDefault)
            .TextFrame.Characters(1, Len(ad)).Font.Size = 9
            .TextFrame.Characters(1, Len(ad)).Font.ColorIndex = 0
            .TextFrame.Characters(1, Len(ad)).Font.Bold = 1
            If ad = 0 Then .TextFrame.Characters.Text = "0%"
        End With
    End If
Next
End Sub
 
Upvote 0

Forum statistics

Threads
1,215,003
Messages
6,122,655
Members
449,091
Latest member
peppernaut

We've detected that you are using an adblocker.

We have a great community of people providing Excel help here, but the hosting costs are enormous. You can help keep this site running by allowing ads on MrExcel.com.
Allow Ads at MrExcel

Which adblocker are you using?

Disable AdBlock

Follow these easy steps to disable AdBlock

1)Click on the icon in the browser’s toolbar.
2)Click on the icon in the browser’s toolbar.
2)Click on the "Pause on this site" option.
Go back

Disable AdBlock Plus

Follow these easy steps to disable AdBlock Plus

1)Click on the icon in the browser’s toolbar.
2)Click on the toggle to disable it for "mrexcel.com".
Go back

Disable uBlock Origin

Follow these easy steps to disable uBlock Origin

1)Click on the icon in the browser’s toolbar.
2)Click on the "Power" button.
3)Click on the "Refresh" button.
Go back

Disable uBlock

Follow these easy steps to disable uBlock

1)Click on the icon in the browser’s toolbar.
2)Click on the "Power" button.
3)Click on the "Refresh" button.
Go back
Back
Top