Calculating the percentage of the same values in two different columns

lastcore

New Member
Joined
Sep 15, 2017
Messages
3
Hello guys,

It is the first time I post on this forum, so please don't blame me :)

I have the following issue. There are 2 columns. One with discipline codes and another one with the Job title of the employees.

i4I35i.png
ciFL7M.png


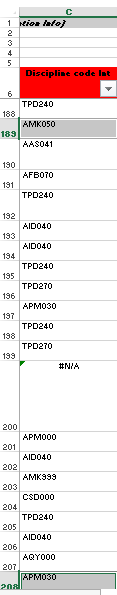
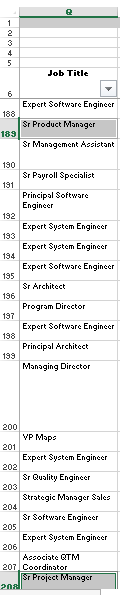
I have to calculate the percentage of Job titles having the same Discipline codes compared to the people who have the same Job titles having different Discipline codes.

For instance, if you take a look at rows Q189 and Q208, both of them have the value Sr Product Manager. The corresponding rows in column C are C189 and C208 but they have different codes. In some cases the Sr Product Managers have the same Discipline code, but sometimes they don't. As, I said I have to calculate the percentage of the same Job titles having different Discipline codes.

Thank you in advance!

P.S. My apologies, I am not a native speaker, thus I can't really explain the issue clearer than that.
 

Excel Facts

Move date out one month or year
Use =EDATE(A2,1) for one month later. Use EDATE(A2,12) for one year later.
codejobtitle
1T1
2T2
3T3
4T4
5T5codeT1T2T3T4T5
6T1110000
7T2201001
8T3310200
9T4401021
2T5520102
3T1622010
4T2702201
5T3810220
6T4901022
7T5
8T1
9T2
3T3
4T4this table shows eg code 5 has 3 different titles and 5 employees
5T5
6T1the 1 directly under T1 from formula
7T2
8T3=SUMPRODUCT(($A$2:$A$36=$F7)*($B$2:$B$36=G$6))
9T4
4T5
5T1it also shows job title T2 occurs in 5 codes
6T2
7T3
8T4
9T5
5T1
6T2
7T3
8T4
9T5

<colgroup><col width="64" span="13" style="width:48pt"> </colgroup><tbody>
</tbody>
 
Upvote 0
Unfortunately, it didn't work. Besides, I am only getting N/A's :confused: Nevertheless, thank you for the effort oldbrewer.
 
Upvote 0
What didn't work? Wrong answer? No answer? something else?

Keep in mind that OB gave you a COUNT of the instances, not the % - you would need to run the % based on his answers
 
Upvote 0
as FD says very easy now to add percentages to the table. Sum every row with a total of 2 or more = 32 and express that as a total of all job titles
 
Upvote 0
What didn't work? Wrong answer? No answer? something else?

Keep in mind that OB gave you a COUNT of the instances, not the % - you would need to run the % based on his answers

It was my fault. I misunderstood the answer of oldbrewer.

Thank you guys for the support!
 
Upvote 0

Forum statistics

Threads
1,215,065
Messages
6,122,945
Members
449,095
Latest member
nmaske

We've detected that you are using an adblocker.

We have a great community of people providing Excel help here, but the hosting costs are enormous. You can help keep this site running by allowing ads on MrExcel.com.
Allow Ads at MrExcel

Which adblocker are you using?

Disable AdBlock

Follow these easy steps to disable AdBlock

1)Click on the icon in the browser’s toolbar.
2)Click on the icon in the browser’s toolbar.
2)Click on the "Pause on this site" option.
Go back

Disable AdBlock Plus

Follow these easy steps to disable AdBlock Plus

1)Click on the icon in the browser’s toolbar.
2)Click on the toggle to disable it for "mrexcel.com".
Go back

Disable uBlock Origin

Follow these easy steps to disable uBlock Origin

1)Click on the icon in the browser’s toolbar.
2)Click on the "Power" button.
3)Click on the "Refresh" button.
Go back

Disable uBlock

Follow these easy steps to disable uBlock

1)Click on the icon in the browser’s toolbar.
2)Click on the "Power" button.
3)Click on the "Refresh" button.
Go back
Back
Top