Counting the number of rows that meet multiple criteria

D-Angle

New Member
Joined
Aug 24, 2011
Messages
23
Hello all :)

I'm a long-time reader of these boards, they have given me a lot of help and tips in the past and kept me in a job on more than one occasion. :) I'm now stuck on a spreadsheet in which I am trying to analyse a large amount of data using formulas, and none of the suggested solutions I have found seem to work. This is a section of the dataset I am working on, it's a sheet of hourly prices of the FTSE100 Index:
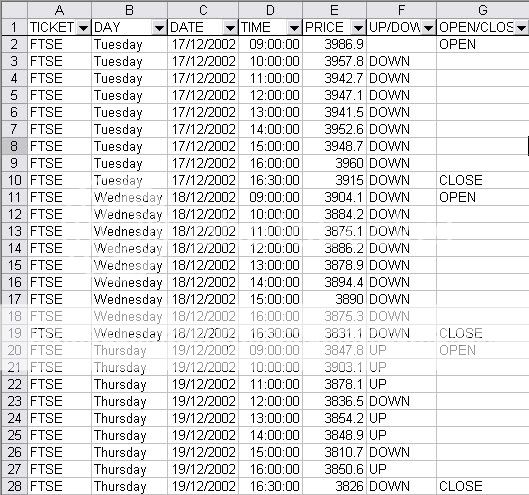
FTSEsheet.jpg


What I would like to do, is count the number of rows that meet the same criteria in multiple cells. For example, I would like to count how many times the index was up at 3pm on a Wednesday, how many times it opened down on a Tuesday etc. I would also like to get more complex results as well, such as how many times the index was, say, up at 3pm when it was down at 10am, which I think would be easier to generate if I could count how many rows met those 2 criteria to start with. Most of my searching suggested DCOUNTA, but nothing seems to give a valid result.

Any suggestions greatly appreciated!
 

Excel Facts

Copy a format multiple times
Select a formatted range. Double-click the Format Painter (left side of Home tab). You can paste formatting multiple times. Esc to stop
Use SUMPRODUCT :

=SUMPRODUCT((B:B="Wednesday")*(G:G="OPEN")) would return 1.
Except this won't work on older versions of excel. Before 2007, you couldn't include an entire column as a range definition

Use:

=SUMPRODUCT((B2:B28="Wednesday")*(G2:G28="OPEN"))

for your included data sample, for instance.
 
Upvote 0
But it opens every Wednesday, except Christmas every 7 years or so. The OP wanted to find the number of times it opens up on a Wednesday. which requires comparison to the closing Tuesday index
 
Upvote 0
Thanks WinteE And Weaver, I should have mentioned that I'm using Excel 2003. Weaver's formula did work, but I'm having trouble expanding the formula to extract more specific information. I have tried this formula:

=SUMPRODUCT((B2:B10000="Wednesday")*(D2:D10000="12:00:00")*(F2:F10000="UP"))

Which I hoped would give the number of times the index was up at 12:00 on a Wednesday. But it returns a result of 0, and having checked the sheet there are definitely rows that meet the criteria. Could it be something to do with the cell containing the time? The above formula works when it isn't included, for example

=SUMPRODUCT((B2:B10000="Wednesday")*(F2:F10000="UP")*(G2:G10000="CLOSE"))

returns the number of times on a Wednesday the index was up when it closed.

konew1, the spreadsheet already has a comparison to the previous closing index in column F. F11 contains the formula =IF(E11>E10,"UP","DOWN"), to compare the amount in column E to the amount in the row before and return an appropriate value.
 
Upvote 0
=SUMPRODUCT((B2:B10000="Wednesday")*(TEXT(D2:D10000,"HH:MM:SS")="12:00:00")*(F2:F10000="UP"))
 
Upvote 0
Yes! Thank you FormR, that works a treat! :)

Hi guys,

I have a similar query but the formulae provided in this forum aren't working for my data. Essentially I want to count the number of rows that contain text 'True' in either of the 4 columns I have. I do not want the formula to count the row twice if that row which has the text 'True' is in column C as well as D.

I am using Excel Microsoft Office Professional 2010. Any help would be appreciated.
 
Upvote 0
Hi, welcome to the Forum!

Assuming the "TRUE" value is actually text and not a Boolean value, then one option might be:

=SUMPRODUCT(--((A1:A100="TRUE")+(B1:B100="TRUE")+(C1:C100="TRUE")+(D1:D100="TRUE")>0))
 
Upvote 0
Hi, welcome to the Forum!

Assuming the "TRUE" value is actually text and not a Boolean value, then one option might be:

=SUMPRODUCT(--((A1:A100="TRUE")+(B1:B100="TRUE")+(C1:C100="TRUE")+(D1:D100="TRUE")>0))


Thanks FormR! I just tried this and the result comes back 0 which is not right. Btw you are correct that "TRUE" is actually text.
 
Upvote 0

Forum statistics

Threads
1,224,599
Messages
6,179,831
Members
452,947
Latest member
Gerry_F

We've detected that you are using an adblocker.

We have a great community of people providing Excel help here, but the hosting costs are enormous. You can help keep this site running by allowing ads on MrExcel.com.
Allow Ads at MrExcel

Which adblocker are you using?

Disable AdBlock

Follow these easy steps to disable AdBlock

1)Click on the icon in the browser’s toolbar.
2)Click on the icon in the browser’s toolbar.
2)Click on the "Pause on this site" option.
Go back

Disable AdBlock Plus

Follow these easy steps to disable AdBlock Plus

1)Click on the icon in the browser’s toolbar.
2)Click on the toggle to disable it for "mrexcel.com".
Go back

Disable uBlock Origin

Follow these easy steps to disable uBlock Origin

1)Click on the icon in the browser’s toolbar.
2)Click on the "Power" button.
3)Click on the "Refresh" button.
Go back

Disable uBlock

Follow these easy steps to disable uBlock

1)Click on the icon in the browser’s toolbar.
2)Click on the "Power" button.
3)Click on the "Refresh" button.
Go back
Back
Top