Hi,
My first post here, and hopefully a) it makes sense, and b) someone can help!
Scenario:
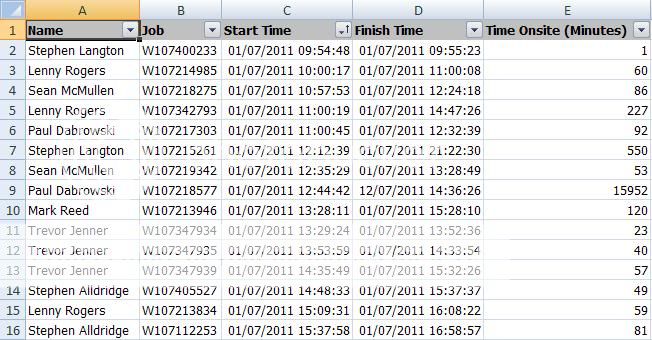
I have some data in excel, containing various jobs. Each job has a start time and an end time (separate columns):

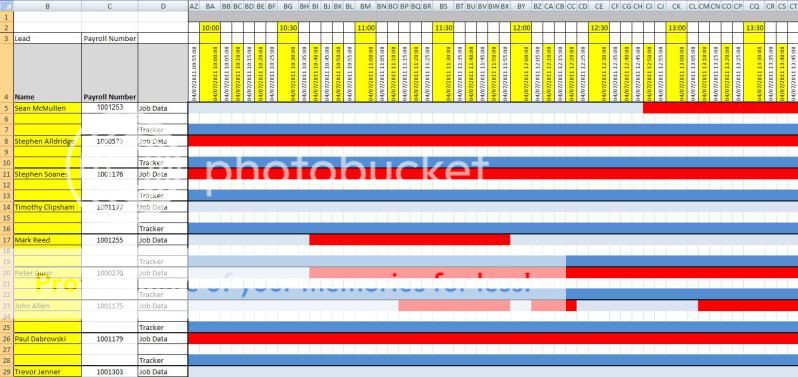
I have created a gantt style chart on a new tab that currently auto populates depending on the data using the following formula:
=IF(AND($B17<>""),1-SUMPRODUCT((data!$C$2:$C$650<=BI$4)*(data!$D$2:$D$650>=BI$4)*(data!$A$2:$A$650=$B17)),"")
where b## is Engineer Name (on gantt tab)
data!c## is Job Start Time
BI## is times (on gantt tab)
data!D## is the Job Finish Time
data!A## is Engineer Name.

Essentially the formula looks at what Name is in column b on the gantt sheet, and brings back the data for that engineer from the corresponding column in the data tab. It then populates the start time column depending on the job start time in the data tab, and likewise the finish time depending on the finish job time. The formula populates the cells in the gantt with a '0' if there is data, and '1' if not. I have then used some conditional formatting so that '0's are solid blocks in red, and '1's are pale blue.
Making sense so far?!
This method is working, but I have 2 issues.
1) The time intervals on the gantt tab are 5 minutes. If however, there is a job that has a start and end time less than 5 minutes, my formula doesn't know where to place the job, and so doesn't display it. The only way I can remedy this is to decrease the time intervals, to minutes. However, if a job is started and finished in less than a minute, the same issue occurs. Any ideas of how to get around this?
2) Is there a way of displaying the Job number (taken from the data tab) on the gantt, so it is easy to see without flicking between the two tabs?
I hope this makes sense, if not, I'll amend it as necessary!
Thanks in advance
Steve
My first post here, and hopefully a) it makes sense, and b) someone can help!
Scenario:
I have some data in excel, containing various jobs. Each job has a start time and an end time (separate columns):

I have created a gantt style chart on a new tab that currently auto populates depending on the data using the following formula:
=IF(AND($B17<>""),1-SUMPRODUCT((data!$C$2:$C$650<=BI$4)*(data!$D$2:$D$650>=BI$4)*(data!$A$2:$A$650=$B17)),"")
where b## is Engineer Name (on gantt tab)
data!c## is Job Start Time
BI## is times (on gantt tab)
data!D## is the Job Finish Time
data!A## is Engineer Name.

Essentially the formula looks at what Name is in column b on the gantt sheet, and brings back the data for that engineer from the corresponding column in the data tab. It then populates the start time column depending on the job start time in the data tab, and likewise the finish time depending on the finish job time. The formula populates the cells in the gantt with a '0' if there is data, and '1' if not. I have then used some conditional formatting so that '0's are solid blocks in red, and '1's are pale blue.
Making sense so far?!
This method is working, but I have 2 issues.
1) The time intervals on the gantt tab are 5 minutes. If however, there is a job that has a start and end time less than 5 minutes, my formula doesn't know where to place the job, and so doesn't display it. The only way I can remedy this is to decrease the time intervals, to minutes. However, if a job is started and finished in less than a minute, the same issue occurs. Any ideas of how to get around this?
2) Is there a way of displaying the Job number (taken from the data tab) on the gantt, so it is easy to see without flicking between the two tabs?
I hope this makes sense, if not, I'll amend it as necessary!
Thanks in advance
Steve


