I have an table that looks like this:
<tbody>
</tbody>
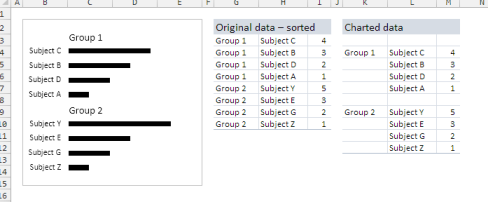
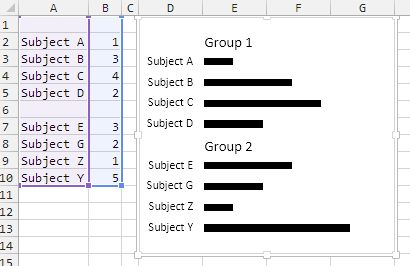
i can't figure out how to create a diagram, that groups the data via the Group column / and i don't know if it's possible at all :-/
it seems i can't insert images from dropbox so i had to add a link
but here is a sketch that shows what i'm trying to achieve
https://www.dropbox.com/s/7hef1hhv2q5ecez/Capture.PNG?dl=0
thanks
jorgensen
| Group 1 | Subject A | 1 |
| Group 1 | Subject B | 3 |
| Group 1 | Subject C | 4 |
| Group 1 | Subject D | 2 |
| Group 2 | Subject E | 3 |
| Group 2 | Subject G | 2 |
| Group 2 | Subject Z | 1 |
| Group 2 | Subject Y | 5 |
<tbody>
</tbody>
i can't figure out how to create a diagram, that groups the data via the Group column / and i don't know if it's possible at all :-/
it seems i can't insert images from dropbox so i had to add a link
but here is a sketch that shows what i'm trying to achieve
https://www.dropbox.com/s/7hef1hhv2q5ecez/Capture.PNG?dl=0
thanks
jorgensen
")