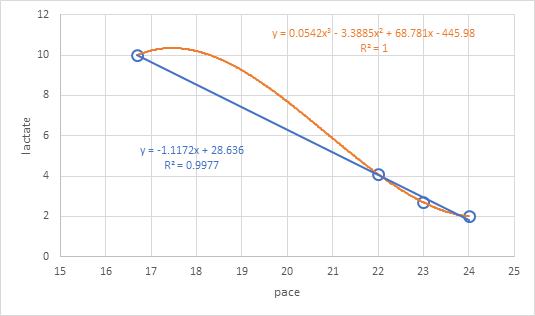
because I have only four or max five samples I need a function to extrapolate for another value of x ( x can be hart rate, speed(pace) or lactate)
It is generally a bad idea to extrapolate based on a polynomial trendline.
If we have "n" data points, we can always get a 100% fit (R^2=1) with a polynomial of n-1 degrees.
But the behavior of such a polynomial outside the data points (and sometimes even between the data points) can be radically different than what we might expect based on visual inspection.
The only time that extrapolation (and arguably interpolation) makes good sense is if the polynomial actually represents the natural behavior of the data model.
IS there a way to get the coefficients of a function of the form x²+x+cte rather then overtyping then each time
shg demonstrates how to use LINEST for that purpose in posting #4.
However, there are data sets for which LINEST does not behave as well as the chart trendline algorithm. I believe that happens because the input to LINEST is arrays of exponentially-scaled values, resulting in differences beyond the limits of 64-bit binary floating-point.
(Note: I am not talking about when LINEST and the chart trendline derive very different coefficients. That is possible and okay, as long as both predict about the same yhat.)
If the LINEST coefficients do not seem to work, it might be necessary and sufficient to copy the coefficients from the chart trendline label.
But if you do that, be sure to format the trendline label to display sufficient precision. I prefer to use the format Scientific with 14 decimal places. That's the maximum precision that Excel chooses to format; and it works equally well for all coefficients, regardless of magnitude.
-----
PS.... I see that both of those points were already covered by John Peltier. Klunk!