Graphs comparing appointment duration.

Driv3ra89

New Member
Joined
Feb 24, 2019
Messages
1
Hi

I was assigned a project at my work to represent a visual graph on appointment duration. I schedule appointments for my doctor and our boss wants to see if hes completing the scheduled appointments on time. I was thinking of using a visual chart that would compare his actual scheduled appointment vs the actual time he checked them in/out. I'm thinking its possible to achieve this with a Gantt Chart ( i never created one so i'm not sure if its possible yet). Would anyone have any other recommendations?

For example:
Appointment scheduled for 9:00am - 9:40am. Actual check in/out time was 9:10-10:00am. I would want the chart to represent he started late and finished late for this appointment. I'll probably be recording his duration. I feel confident i can create a table with the necessary information, i just need a graph that can shows it.
 

Excel Facts

Create a chart in one keystroke
Select the data and press Alt+F1 to insert a default chart. You can change the default chart to any chart type
do you want to show every appointment in a gantt chart
or would perhaps some form of % pie chart - % started late, % ontime, % finished early, % late
Average late start , average overrun
Number of appointments started late , number of appointments finished late , Number of appointments started early , Number of appointments finished early

are the appointments usually at a standard time like, 9 , 10, 11 oclock
Do they last a standard time ie 40mins

do you have a sample set of data of how you capture the appointment information

theres an interesting article on appointment times here , with graphs - not saying I can reproduce the graph, but may give you an idea of what you want to portray
https://essay.utwente.nl/57961/1/scriptie_J_Westeneng.pdf
 
Last edited:
Upvote 0
Driv3ra89,
I did something similar a few years back using a Pivot Table and Pivot Chart.
With data similar to this:
Excel 2007 32 bit
[COLOR=[URL=https://www.mrexcel.com/forum/usertag.php?do=list&action=hash&hash=FFFFFF]#FFFFFF[/URL] ]B[/COLOR]​
[COLOR=[URL=https://www.mrexcel.com/forum/usertag.php?do=list&action=hash&hash=FFFFFF]#FFFFFF[/URL] ]C[/COLOR]​
[COLOR=[URL=https://www.mrexcel.com/forum/usertag.php?do=list&action=hash&hash=FFFFFF]#FFFFFF[/URL] ]D[/COLOR]​
[COLOR=[URL=https://www.mrexcel.com/forum/usertag.php?do=list&action=hash&hash=FFFFFF]#FFFFFF[/URL] ]E[/COLOR]​
[COLOR=[URL=https://www.mrexcel.com/forum/usertag.php?do=list&action=hash&hash=FFFFFF]#FFFFFF[/URL] ]F[/COLOR]​
[COLOR=[URL=https://www.mrexcel.com/forum/usertag.php?do=list&action=hash&hash=FFFFFF]#FFFFFF[/URL] ]G[/COLOR]​
[COLOR=[URL=https://www.mrexcel.com/forum/usertag.php?do=list&action=hash&hash=FFFFFF]#FFFFFF[/URL] ]H[/COLOR]​
[COLOR=[URL=https://www.mrexcel.com/forum/usertag.php?do=list&action=hash&hash=FFFFFF]#FFFFFF[/URL] ]I[/COLOR]​
[COLOR=[URL=https://www.mrexcel.com/forum/usertag.php?do=list&action=hash&hash=FFFFFF]#FFFFFF[/URL] ]J[/COLOR]​
[COLOR=[URL=https://www.mrexcel.com/forum/usertag.php?do=list&action=hash&hash=FFFFFF]#FFFFFF[/URL] ]K[/COLOR]​
[COLOR=[URL=https://www.mrexcel.com/forum/usertag.php?do=list&action=hash&hash=FFFFFF]#FFFFFF[/URL] ]1[/COLOR]​
Ar Time​
Tr Time​
Wait Time (TT-AT)​
Dr Time​
Wait Time (DT-AT)​
Day​
Date​
Actual Duration​
Ar Hour​
Scheduled Duration​
[COLOR=[URL=https://www.mrexcel.com/forum/usertag.php?do=list&action=hash&hash=FFFFFF]#FFFFFF[/URL] ]2[/COLOR]​
9:11 AM​
9:20 AM​
9
9:30 AM​
0:19​
Mon
10/17/2011​
19
9:00 AM​
20​
[COLOR=[URL=https://www.mrexcel.com/forum/usertag.php?do=list&action=hash&hash=FFFFFF]#FFFFFF[/URL] ]3[/COLOR]​
5:09 PM​
5:10 PM​
1
5:10 PM​
0:01​
Tues
10/18/2011​
1
5:00 PM​
20​
[COLOR=[URL=https://www.mrexcel.com/forum/usertag.php?do=list&action=hash&hash=FFFFFF]#FFFFFF[/URL] ]4[/COLOR]​
3:10 PM​
3:11 PM​
1
3:45 PM​
0:35​
Tues
10/18/2011​
35
3:00 PM​
20​
[COLOR=[URL=https://www.mrexcel.com/forum/usertag.php?do=list&action=hash&hash=FFFFFF]#FFFFFF[/URL] ]5[/COLOR]​
10:25 AM​
10:55 AM​
30
11:10 AM​
0:45​
Sun
10/23/2011​
45
10:00 AM​
20​
[COLOR=[URL=https://www.mrexcel.com/forum/usertag.php?do=list&action=hash&hash=FFFFFF]#FFFFFF[/URL] ]6[/COLOR]​
9:45 PM​
9:50 PM​
5
10:10 PM​
0:25​
Wed
10/26/2011​
25
9:00 PM​
20​
[COLOR=[URL=https://www.mrexcel.com/forum/usertag.php?do=list&action=hash&hash=FFFFFF]#FFFFFF[/URL] ]7[/COLOR]​
1:09 PM​
1:12 PM​
3
1:32 PM​
0:23​
Fri
10/28/2011​
23
1:00 PM​
20​
[COLOR=[URL=https://www.mrexcel.com/forum/usertag.php?do=list&action=hash&hash=FFFFFF]#FFFFFF[/URL] ]8[/COLOR]​
12:45 PM​
12:54 PM​
9
2:07 PM​
1:22​
Sun
10/30/2011​
82
12:00 PM​
20​
[COLOR=[URL=https://www.mrexcel.com/forum/usertag.php?do=list&action=hash&hash=FFFFFF]#FFFFFF[/URL] ]9[/COLOR]​
10:50 AM​
10:52 AM​
2
11:15 AM​
0:25​
Tues
11/1/2011​
25
10:00 AM​
20​
[COLOR=[URL=https://www.mrexcel.com/forum/usertag.php?do=list&action=hash&hash=FFFFFF]#FFFFFF[/URL] ]10[/COLOR]​
7:33 PM​
7:40 PM​
7
8:22 PM​
0:49​
Wed
11/2/2011​
49
7:00 PM​
20​
[COLOR=[URL=https://www.mrexcel.com/forum/usertag.php?do=list&action=hash&hash=FFFFFF]#FFFFFF[/URL] ]11[/COLOR]​
10:11 AM​
10:20 AM​
9
10:40 AM​
0:29​
Wed
11/2/2011​
29
10:00 AM​
20​
[COLOR=[URL=https://www.mrexcel.com/forum/usertag.php?do=list&action=hash&hash=FFFFFF]#FFFFFF[/URL] ]12[/COLOR]​
12:06 PM​
12:15 PM​
9
12:50 PM​
0:44​
Wed
11/2/2011​
44
12:00 PM​
20​
[COLOR=[URL=https://www.mrexcel.com/forum/usertag.php?do=list&action=hash&hash=FFFFFF]#FFFFFF[/URL] ]13[/COLOR]​
3:58 PM​
3:59 PM​
1
4:10 PM​
0:12​
Fri
11/4/2011​
12
3:00 PM​
20​
[COLOR=[URL=https://www.mrexcel.com/forum/usertag.php?do=list&action=hash&hash=FFFFFF]#FFFFFF[/URL] ]14[/COLOR]​
7:49 PM​
7:52 PM​
3
7:58 PM​
0:09​
Fri
11/4/2011​
9
7:00 PM​
20​
[COLOR=[URL=https://www.mrexcel.com/forum/usertag.php?do=list&action=hash&hash=FFFFFF]#FFFFFF[/URL] ]15[/COLOR]​
Copy these formula down:
[COLOR=[URL=https://www.mrexcel.com/forum/usertag.php?do=list&action=hash&hash=FFFFFF]#FFFFFF[/URL] ]16[/COLOR]​
I2 =IF(OR(B2="",E2=""),"Missing Data",HOUR(E2-B2+IF(B2>E2,1))*60+MINUTE(E2-B2+IF(B2>E2,1)))
[COLOR=[URL=https://www.mrexcel.com/forum/usertag.php?do=list&action=hash&hash=FFFFFF]#FFFFFF[/URL] ]17[/COLOR]​
J2 =FLOOR(B2, "1:00")

<tbody>
</tbody>
Sheet: Sheet1

<tbody>
</tbody>

First I inserted a 'Pivot Chart' using the 'Insert' tab left position right next to 'Home' tab...Excel asks for the range to be included and where you want the chart to be displayed...same worksheet or another one.
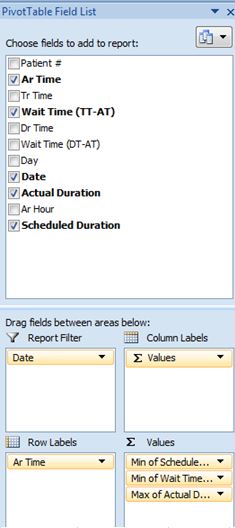
Then I filled out the 'Field List' which is displayed automatically...below is a picture of the way I filled out the Field List...Notice the column header lables on the Data sheet shown in orange are the fields I selected in the Pivot Table Field List. I dragged each field to the appropriate box below...
sLjbMyj.jpg


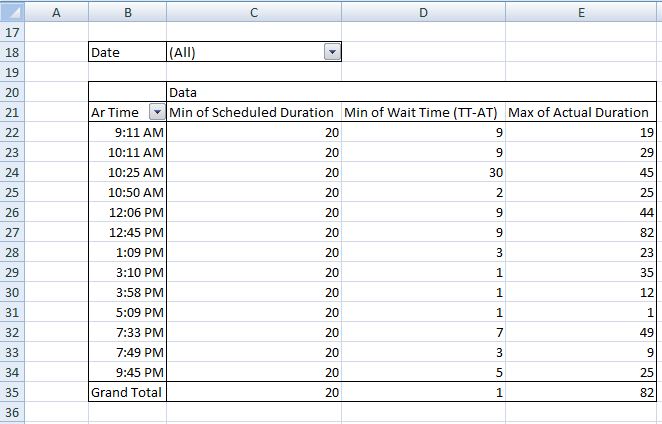
and this is the related Pivot Table that is created...

Dsc41Zg.jpg


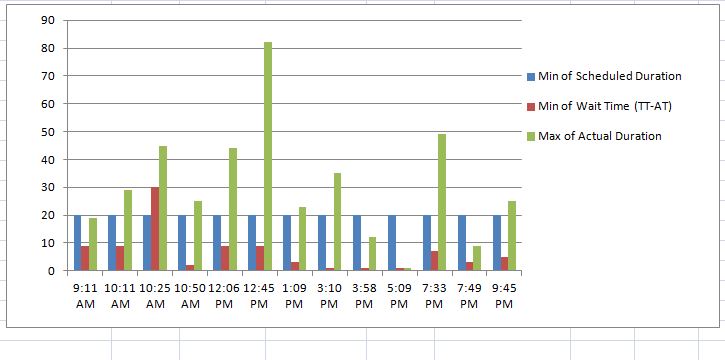
The resulting Pivot Chart looks like this...

uUMIZvj.jpg


Perhaps the above will assist you.
Perpa
 
Upvote 0

Forum statistics

Threads
1,215,018
Messages
6,122,703
Members
449,093
Latest member
Mnur

We've detected that you are using an adblocker.

We have a great community of people providing Excel help here, but the hosting costs are enormous. You can help keep this site running by allowing ads on MrExcel.com.
Allow Ads at MrExcel

Which adblocker are you using?

Disable AdBlock

Follow these easy steps to disable AdBlock

1)Click on the icon in the browser’s toolbar.
2)Click on the icon in the browser’s toolbar.
2)Click on the "Pause on this site" option.
Go back

Disable AdBlock Plus

Follow these easy steps to disable AdBlock Plus

1)Click on the icon in the browser’s toolbar.
2)Click on the toggle to disable it for "mrexcel.com".
Go back

Disable uBlock Origin

Follow these easy steps to disable uBlock Origin

1)Click on the icon in the browser’s toolbar.
2)Click on the "Power" button.
3)Click on the "Refresh" button.
Go back

Disable uBlock

Follow these easy steps to disable uBlock

1)Click on the icon in the browser’s toolbar.
2)Click on the "Power" button.
3)Click on the "Refresh" button.
Go back
Back
Top