nigelandrewfoster
Well-known Member
- Joined
- May 27, 2009
- Messages
- 747
Hello there!
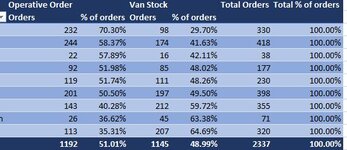
* I have created a Pivot Table initially with two columns: A (sales order type 1) and B (sales order type 2).
* I've added a calculated column to give A and B as a percentage of the total (A+B). So far so good. Had to do a fair bit of hunting to find out how to sort the table by %, but that's another story.
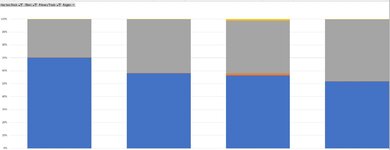
* I have created a pivot chart (a stacked bar chart) to show simultaneously A+B (total orders from each customer) and how many of each type of order makes up the total. Looks great.
Problem - the stacked bar chart also includes the calculated fields (the percentages) so the bar ACTUALLY shows A + B + (A/(A+B)) + (B/(A+B)). How can I
1) Keep the percentages on the pivot table (needed, to sort by %)
2) Only display A and B on the pivot chart
3) Keep everything dynamic (i.e. avoid just using a regular chart)
Many thanks for your time
Nigel Foster
* I have created a Pivot Table initially with two columns: A (sales order type 1) and B (sales order type 2).
* I've added a calculated column to give A and B as a percentage of the total (A+B). So far so good. Had to do a fair bit of hunting to find out how to sort the table by %, but that's another story.
* I have created a pivot chart (a stacked bar chart) to show simultaneously A+B (total orders from each customer) and how many of each type of order makes up the total. Looks great.
Problem - the stacked bar chart also includes the calculated fields (the percentages) so the bar ACTUALLY shows A + B + (A/(A+B)) + (B/(A+B)). How can I
1) Keep the percentages on the pivot table (needed, to sort by %)
2) Only display A and B on the pivot chart
3) Keep everything dynamic (i.e. avoid just using a regular chart)
Many thanks for your time
Nigel Foster