I have a massive data table that only has data entered into certain columns for each row. I'm trying to create a chart where all of my data is evenly spaced, but because each column has blanks interspersed I get gaps in my chart. How do I get Excel to ignore these and plot the values in a consecutive fashion?
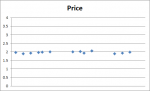
Here is what my chart looks like.

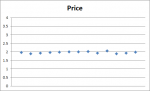
Here is what I want my chart to look like.

I have a feeling there's a very easy solution but my extensive Google searches only tell me how to connect the dots.
Thank you,
Dusty
Here is what my chart looks like.
Here is what I want my chart to look like.
I have a feeling there's a very easy solution but my extensive Google searches only tell me how to connect the dots.
Thank you,
Dusty