Macro to convert data to a more standard form?

REvans81

New Member
Joined
Apr 25, 2018
Messages
21
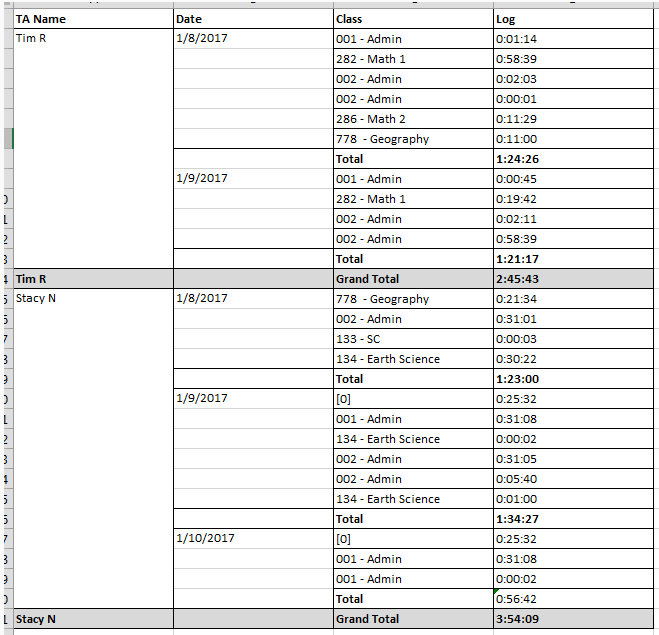
I'm not really sure how to explain this... basically I get reports on student grades for tests/projects on different dates. THe report that's generated can export to excel but it's not the easiest to work with. I'd like to make a macro to convert this data to a different format (Like student names in rows, classes in columns, scores in the cells) but the classes and size of the data set is going to vary. Ultimately, I'd like to make a pivot table with the converted data as we have a third party requesting it in this format.

sample report:

Student Name

<tbody>
</tbody>
DateClassScore TypeScore
Suzie H

<tbody>
</tbody>
1/2/2018

<tbody>
</tbody>
282 - Math 1
Quiz

<tbody>
</tbody>
90
1/8/2018

<tbody>
</tbody>
778 - Geography

<tbody>
</tbody>
Quiz

<tbody>
</tbody>
87
1/11/2018
117 - Social Studies

<tbody>
</tbody>
Homework

<tbody>
</tbody>
89
2/4/2018

<tbody>
</tbody>
282 - Math 1
Homework

<tbody>
</tbody>
89
2/7/2018

<tbody>
</tbody>
282 - Math 1
Homework

<tbody>
</tbody>
95
2/12/2018

<tbody>
</tbody>
778 - Geography

<tbody>
</tbody>
Quiz

<tbody>
</tbody>
77
Suzie HSponsor: Jim KAverage87.83
Jimmy R
1/2/2018

<tbody>
</tbody>
286 - Math 2

<tbody>
</tbody>
Homework85
1/8/2018
134 - Earth Science

<tbody>
</tbody>
Quiz89
1/9/2018

<tbody>
</tbody>
117 - Social Studies

<tbody>
</tbody>
Homework84
1/10/2018

<tbody>
</tbody>
286 - Math 2Homework90
2/2/2018

<tbody>
</tbody>
778 - Geography

<tbody>
</tbody>
Homework89
2/8/2018

<tbody>
</tbody>
778 - Geography

<tbody>
</tbody>
Project85
4/5/2018

<tbody>
</tbody>
286 - Math 2Homework77
Jimmy RSponsor: Jim KAverage85.57

<tbody>
</tbody>


The only items I really care about are the names, dates, class, and score (I don't need sponsor, average, or score type). I don't care what it looks like when it's converted, I just have to be able make a pivot table with the data.

I haven't had any formal training and I'm not very good at starting visual basic projects so I don't really know how to kick it off but nobody else here knows much of anything about excel. I know how to make pivot tables and I can usually tinker with the code after it's written in order to tweak it a bit.

If anyone is able to assist, I'd appreciate it!!!
 
So it only needs minor modifications it seems. Here's what I have but it's not adding up the values for some reason, I get mostly zeros

Code:
Sub rearrangeData()

   Dim Cl As Range
   Dim Ws1 As Worksheet
   Dim Ws2 As Worksheet
   Dim Rng As Range
   Dim Ary() As Long
   Dim i As Long
   
   i = 1
   Set Ws1 = Sheets("nrd")
   Set Ws2 = Sheets("nrdtest")
   'Set Ws2 = Sheets.Add(, Sheets(Sheets.Count))
   ' Ws2.Name = "test"
   With CreateObject("scripting.dictionary")
      For Each Cl In Ws1.Range("C2", Ws1.Range("C" & Rows.Count).End(xlUp))
         If Not .exists(Cl.Value) And Not IsEmpty(Cl.Value) Then
            .Add Cl.Value, i
            i = i + 1
         End If
      Next Cl
      Ws2.Range("A1").Value = "TA Name"
      Ws2.Range("B1").Resize(, .Count).Value = .keys
      For Each Rng In Ws1.Range("C2", Ws1.Range("C" & Rows.Count).End(xlUp)).SpecialCells(xlConstants).Areas
         ReDim Ary(1 To .Count)
         For Each Cl In Rng
            If .exists(Cl.Value) Then Ary(.Item(Cl.Value)) = Ary(.Item(Cl.Value)) + Cl.Offset(, 2).Value
         Next Cl
         With Ws2.Range("A" & Rows.Count).End(xlUp).Offset(1)
            .Value = Rng.Offset(, -2).Resize(1, 1).Value
            .Offset(, 1).Resize(, UBound(Ary)).Value = Ary
         End With
      Next Rng
   End With
End Sub
 
Upvote 0

Excel Facts

Can a formula spear through sheets?
Use =SUM(January:December!E7) to sum E7 on all of the sheets from January through December
If the values you are trying to add are in col D try
Code:
If .exists(Cl.Value) Then Ary(.Item(Cl.Value)) = Ary(.Item(Cl.Value)) + Cl.Offset(, [COLOR=#ff0000]1[/COLOR]).Value
 
Upvote 0
I tried that too but it's still not adding up, I get names in rows and classes in columns perfectly but the results are all 0:00:00
 
Upvote 0
Code:
Sub rearrangeData()

   Dim Cl As Range
   Dim Ws1 As Worksheet
   Dim Ws2 As Worksheet
   Dim Rng As Range
   Dim Ary() As Long
   Dim i As Long
   
   'Clear sheet
   Sheets("nrdtest").UsedRange.ClearContents
   
   i = 1
   Set Ws1 = Sheets("nrd")
   Set Ws2 = Sheets("nrdtest")
   'Set Ws2 = Sheets.Add(, Sheets(Sheets.Count))
   ' Ws2.Name = "test"
   With CreateObject("scripting.dictionary")
      For Each Cl In Ws1.Range("C2", Ws1.Range("C" & Rows.Count).End(xlUp))
         If Not .exists(Cl.Value) And Not IsEmpty(Cl.Value) Then
            .Add Cl.Value, i
            i = i + 1
         End If
      Next Cl
      Ws2.Range("A1").Value = "TA Name"
      Ws2.Range("B1").Resize(, .Count).Value = .keys
      For Each Rng In Ws1.Range("C2", Ws1.Range("C" & Rows.Count).End(xlUp)).SpecialCells(xlConstants).Areas
         ReDim Ary(1 To .Count)
         For Each Cl In Rng
            If .exists(Cl.Value) Then Ary(.Item(Cl.Value)) = Ary(.Item(Cl.Value)) + Cl.Offset(, 1).Value
         Next Cl
         With Ws2.Range("A" & Rows.Count).End(xlUp).Offset(1)
            .Value = Rng.Offset(, -2).Resize(1, 1).Value
            .Offset(, 1).Resize(, UBound(Ary)).Value = Ary
         End With
      Next Rng
   End With
End Sub
 
Upvote 0
Ok, it's because you are adding up time, so make this change
Code:
   Dim Ary() As [COLOR=#ff0000]Double[/COLOR]
 
Upvote 0
Oh, duh... thank you for that. The only other issue now is it's only totaling up the results for each TA for the first date


So for this:

CxS69CK.png


Totals are showing as follows

001 - Admin002 - Admin282 - Math 1286 - Math 2778 - Geography133 - SC134 - Earth Science
Tim R0:01:140:02:040:58:390:11:290:11:000:00:000:00:00
Stacy N0:00:000:31:010:00:000:00:000:21:340:00:030:30:22

<tbody>
</tbody>


rather than totaling each date per person per class
 
Upvote 0

Excel 2013/2016
ABCD
1TA NameDateClassDuration
2Tim R1/8/2018Admin[001]1:22:00
3Math 1[282]0:33:01
4Admin[002]0:45:00
5Math 2[286]0:15:00
6Geography[778]0:55:14
73:50:15
81/9/2018Math 1[282]0:00:45
9Admin[002]0:45:00
10SC[133]0:02:11
11Admin[001]0:58:39
12Math 2[286]0:04:52
131:51:27
141/10/2018Admin[001]1:22:00
15Admin[002]0:45:00
162:07:00
171/11/2018[0]0:04:36
18Admin[001]1:22:00
19Admin[002]0:45:00
20SC[133]0:55:00
21Math 1[282]0:25:00
223:31:36
23Tim R11:20:18
24Stacy N1/9/2018Admin[001]1:00:00
25Admin[002]0:30:00
26SC[133]0:15:00
27Earth Science[134]0:25:15
282:10:15
291/10/2018Admin[001]1:00:00
30Admin[002]0:30:00
31SC[133]0:15:00
321:45:00
33Stacy N3:55:15
TA
 
Upvote 0
In your image there are cells with "Total" & "Grand Total", but not in the sample you have just posted. Do they exist in your data?
 
Upvote 0

Forum statistics

Threads
1,215,326
Messages
6,124,256
Members
449,149
Latest member
mwdbActuary

We've detected that you are using an adblocker.

We have a great community of people providing Excel help here, but the hosting costs are enormous. You can help keep this site running by allowing ads on MrExcel.com.
Allow Ads at MrExcel

Which adblocker are you using?

Disable AdBlock

Follow these easy steps to disable AdBlock

1)Click on the icon in the browser’s toolbar.
2)Click on the icon in the browser’s toolbar.
2)Click on the "Pause on this site" option.
Go back

Disable AdBlock Plus

Follow these easy steps to disable AdBlock Plus

1)Click on the icon in the browser’s toolbar.
2)Click on the toggle to disable it for "mrexcel.com".
Go back

Disable uBlock Origin

Follow these easy steps to disable uBlock Origin

1)Click on the icon in the browser’s toolbar.
2)Click on the "Power" button.
3)Click on the "Refresh" button.
Go back

Disable uBlock

Follow these easy steps to disable uBlock

1)Click on the icon in the browser’s toolbar.
2)Click on the "Power" button.
3)Click on the "Refresh" button.
Go back
Back
Top