Multilevel bar chart show 95% confidence interval

ferdaozdemirsonmez

New Member
Joined
Nov 18, 2019
Messages
2
Hi,
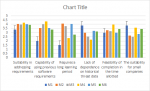
I have a multilevel bar chart. I need to show confidence intervals from the descriptive statistics. I can do this easily when I have single level. But with multiple levels (2 levels) I couldn't manage it.
I don't want to create 6 charts instead of one for this reason. Can someone please help me.
I can provide excel file if necessary.
1591961227305.png
 

Attachments

  • 1591961188500.png
    1591961188500.png
    17.3 KB · Views: 9

Excel Facts

Save Often
If you start asking yourself if now is a good time to save your Excel workbook, the answer is Yes

Forum statistics

Threads
1,214,983
Messages
6,122,595
Members
449,089
Latest member
Motoracer88

We've detected that you are using an adblocker.

We have a great community of people providing Excel help here, but the hosting costs are enormous. You can help keep this site running by allowing ads on MrExcel.com.
Allow Ads at MrExcel

Which adblocker are you using?

Disable AdBlock

Follow these easy steps to disable AdBlock

1)Click on the icon in the browser’s toolbar.
2)Click on the icon in the browser’s toolbar.
2)Click on the "Pause on this site" option.
Go back

Disable AdBlock Plus

Follow these easy steps to disable AdBlock Plus

1)Click on the icon in the browser’s toolbar.
2)Click on the toggle to disable it for "mrexcel.com".
Go back

Disable uBlock Origin

Follow these easy steps to disable uBlock Origin

1)Click on the icon in the browser’s toolbar.
2)Click on the "Power" button.
3)Click on the "Refresh" button.
Go back

Disable uBlock

Follow these easy steps to disable uBlock

1)Click on the icon in the browser’s toolbar.
2)Click on the "Power" button.
3)Click on the "Refresh" button.
Go back
Back
Top