hafiz_asim
New Member
- Joined
- Nov 26, 2017
- Messages
- 4
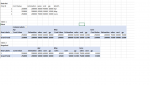
| Data Set | ||||||||||||||||
| Proj ID | Cont Value | Estimation | sales | cost | gp | Month | ||||||||||
1 | 250000 | 200000 | 50000 | 40000 | 10000 | Apr | ||||||||||
1 | 250000 | 200000 | 62500 | 50000 | 12500 | May | ||||||||||
1 | 250000 | 200000 | 75000 | 60000 | 15000 | June | ||||||||||
| Table 1 | ||||||||||||||||
| Pivot | ||||||||||||||||
| Column Labels | ||||||||||||||||
| Apr | May | June | ||||||||||||||
| Row Labels | Cont Value | Estimation | sales | cost | gp | Cont Value | Estimation | sales | cost | gp | Cont Value | Estimation | sales | cost | gp | |
| 1 | 250000 | 200000 | 50000 | 40000 | 10000 | 250000 | 200000 | 62500 | 50000 | 12500 | 250000 | 200000 | 75000 | 60000 | 15000 | |
| Grand Total | 250000 | 200000 | 50000 | 40000 | 10000 | 250000 | 200000 | 62500 | 50000 | 12500 | 250000 | 200000 | 75000 | 60000 | 15000 | |
| Table 2 | ||||||||||||||||
| Required | ||||||||||||||||
| Apr | May | June | ||||||||||||||
| Row Labels | Cont Value | Estimation | sales | cost | gp | sales | cost | gp | sales | cost | gp | |||||
| 1 | 250000 | 200000 | 50000 | 40000 | 10000 | 62500 | 50000 | 12500 | 75000 | 60000 | 15000 | |||||
| Grand Total | 250000 | 200000 | 50000 | 40000 | 10000 | 62500 | 50000 | 12500 | 75000 | 60000 | 15000 | |||||
| Problem | ||||||||||||||||
| Data Set is coming from SQL table, this is how its being read by power pivot, i.e in an unpivot mode. | ||||||||||||||||
| How can I achieve Table 2 result through pivot by altering the data model, through DAX may be summarise function, or any other way? Please guide | ||||||||||||||||
| as soon as I bring months over column values, there is a repetition for cont Value and Estimation for each month which I don’t want. I want to present like table 2 | ||||||||||||||||
| Sets are one way however its very cumbersome and not flexible, for a little change you need to redo the set creation. | ||||||||||||||||
| Please Guide. | ||||||||||||||||
| Thanks |