Power Pivot Repeating Values

Exceladd1ct

Board Regular
Joined
Feb 10, 2019
Messages
76
Hello,

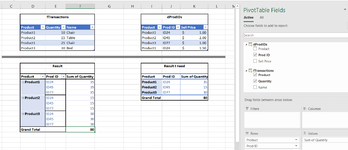
I am trying to build a simple report with data from two different tables in power pivot.

Is there a way to get the result as in the attached image since the common column "Product" has duplicates in both columns and i can't create a One to Many relation.

I use excel power pivot so Many to Many relations are not allowed.

Any sugestions to achieve this result in pover pivot, without vLookup?

Thank you.
 

Attachments

  • 2021-07-29_17h04_00.png
    2021-07-29_17h04_00.png
    53.7 KB · Views: 260

Excel Facts

Format cells as currency
Select range and press Ctrl+Shift+4 to format cells as currency. (Shift 4 is the $ sign).
Try this:
1) Read both tables in the Power Pivot but combine the product names with the products instead of the transactions.
2) Remove the duplicates (if possible)
3) Load both tables into Power Pivot
4) Create a many to one relationship from Transactions Products to ProductIDs Product.
5) Hide the Products and the Names from your transactions table. Might be a good idea to hide all the other columns as well and only create the measures for Products Sold and Total Sales.
6) Create the pivot table with the row labels from your ProductIDs table and the actual numbers from your measures.
 
Upvote 0
I could not do it with Power Pivot, but I was able to achieve your expected results using Power Query. Bring both tables into the PQ editor, join them on the Product. The following Mcode:

Power Query:
let
    Source = Table.NestedJoin(Table1, {"Product"}, Table2, {"Product"}, "Table2", JoinKind.LeftOuter),
    #"Expanded Table2" = Table.ExpandTableColumn(Source, "Table2", {"Prod ID"}, {"Table2.Prod ID"}),
    #"Removed Columns" = Table.RemoveColumns(#"Expanded Table2",{"Name"}),
    #"Removed Duplicates" = Table.Distinct(#"Removed Columns", {"Product", "Quantity"}),
    #"Grouped Rows" = Table.Group(#"Removed Duplicates", {"Product"}, {{"Qty", each List.Sum([Quantity]), type nullable number}, {"ProdID", each _, type table [Product=nullable text, Quantity=nullable number, Table2.Prod ID=nullable text]}}),
    #"Expanded ProdID" = Table.ExpandTableColumn(#"Grouped Rows", "ProdID", {"Table2.Prod ID"}, {"ProdID.Table2.Prod ID"}),
    #"Removed Duplicates1" = Table.Distinct(#"Expanded ProdID", {"Product"}),
    #"Reordered Columns" = Table.ReorderColumns(#"Removed Duplicates1",{"Product", "ProdID.Table2.Prod ID", "Qty"})
in
    #"Reordered Columns"

There may be more efficient code
 
Upvote 0

Forum statistics

Threads
1,215,233
Messages
6,123,772
Members
449,123
Latest member
StorageQueen24

We've detected that you are using an adblocker.

We have a great community of people providing Excel help here, but the hosting costs are enormous. You can help keep this site running by allowing ads on MrExcel.com.
Allow Ads at MrExcel

Which adblocker are you using?

Disable AdBlock

Follow these easy steps to disable AdBlock

1)Click on the icon in the browser’s toolbar.
2)Click on the icon in the browser’s toolbar.
2)Click on the "Pause on this site" option.
Go back

Disable AdBlock Plus

Follow these easy steps to disable AdBlock Plus

1)Click on the icon in the browser’s toolbar.
2)Click on the toggle to disable it for "mrexcel.com".
Go back

Disable uBlock Origin

Follow these easy steps to disable uBlock Origin

1)Click on the icon in the browser’s toolbar.
2)Click on the "Power" button.
3)Click on the "Refresh" button.
Go back

Disable uBlock

Follow these easy steps to disable uBlock

1)Click on the icon in the browser’s toolbar.
2)Click on the "Power" button.
3)Click on the "Refresh" button.
Go back
Back
Top