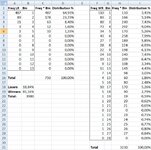
If the distribution in #5 is correct (i.e. if p is 80%, and trials are independent) then in an unbounded sample space, you expect
- 80% of wins to follow an immediately previous win
- 16% of wins to follow a single loss
- 3.2% of wins to follow a run of two losses
etc.
I suspect you're still looking for an answer to your original question, which might be phrased:
I've experienced N losses in a row. What is my chance of a win next time?
The answer to that question is p, regardless of the value of N (as
@shg said in post #2).


")