Project Chart

Roy_Excel_Island_Apps

Board Regular
Joined
Oct 9, 2018
Messages
71
Office Version
  1. 365
Platform
  1. Windows
Hi everyone!

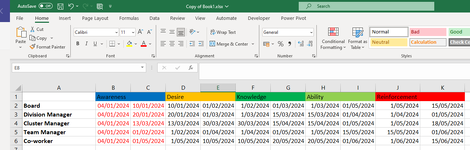
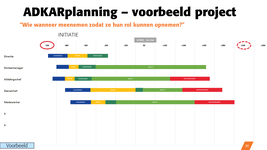
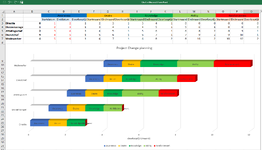
For project management we would like to create the graph in attachment, depending on the table you'll see in the other attachment image.
It's a kind of a gantt chart about the different people in the organisation on the y-axis and different projects (Awareness, Desire, Knowledge, ...) on the x-axis. To make it 'easy', the Awareness project, the first project, starts today. And it starts for everyone on the same day.
How do I get to build this graph?

Please help us out!

Thanks a 1000 times in advance!

Kind regards,
Roy
Belgium
 

Attachments

  • GraphData.PNG
    GraphData.PNG
    45.6 KB · Views: 9
  • MicrosoftTeams-image.png
    MicrosoftTeams-image.png
    32 KB · Views: 9

Excel Facts

When did Power Query debut in Excel?
Although it was an add-in in Excel 2010 & Excel 2013, Power Query became a part of Excel in 2016, in Data, Get & Transform Data.
your 2nd image is much to small to read.

And can you post your data using the xl2bb add in, or pasting the data as a table instead of an image. By using images the forum must recreate your data which is time consuming and can have errors. Link to xl2bb below.

thanks in advance.
 
Upvote 0
your 2nd image is much to small to read.

And can you post your data using the xl2bb add in, or pasting the data as a table instead of an image. By using images the forum must recreate your data which is time consuming and can have errors. Link to xl2bb below.

thanks in advance.
Hi! Can't install add-ins on my laptop from work so I'll have to paste the data in a table:
AwarenessDesireKnowledgeAbilityReinforcement
Board
04/01/2024​
10/01/2024​
10/01/2024​
01/02/2024​
1/02/2024​
01/03/2024​
1/03/2024​
01/05/2024​
1/05/2024​
15/05/2024​
Division Manager
04/01/2024​
20/01/2024​
20/01/2024​
01/03/2024​
1/03/2024​
15/03/2024​
15/03/2024​
01/04/2024​
1/04/2024​
01/05/2024​
Cluster Manager
04/01/2024​
13/03/2024​
13/03/2024​
30/03/2024​
30/03/2024​
15/04/2024​
15/04/2024​
01/05/2024​
1/05/2024​
18/05/2024​
Team Manager
04/01/2024​
01/02/2024​
1/02/2024​
01/04/2024​
1/04/2024​
01/05/2024​
1/05/2024​
15/05/2024​
15/05/2024​
01/06/2024​
Co-worker
04/01/2024​
01/05/2024​
1/05/2024​
10/05/2024​
10/05/2024​
20/05/2024​
20/05/2024​
01/06/2024​
1/06/2024​
15/06/2024​
 
Upvote 0
I understand about the add ins. Thanks for the table. You'll get a response from someone, if not me, much quicker!
A larger screen shot of your desired outcome would also be helpful.
 
Upvote 0
I understand about the add ins. Thanks for the table. You'll get a response from someone, if not me, much quicker!
A larger screen shot of your desired outcome would also be helpful.
This image is better maybe. But the only difference is that we want the figures to be replaced by dates. It works good with figures, but not with dates.
 

Attachments

  • GraphData2.PNG
    GraphData2.PNG
    73.6 KB · Views: 6
Upvote 0
Maybe one of these options?

Chart.zip

1704381911553.png


This first one is a X-Y chart. And the bars you see are the error (only positive one).
You will need a helper table (rows 9 and 10)
For the Board and Division Manager text I added 2 textboxes grouped together.

Then there is simple bar chart:

1704381924857.png


Where you hide the bottom axis and use 30,4375 (days) in the major units.

Not the best options I think but maybe its a start?
 
Upvote 0
Maybe one of these options?

Chart.zip

View attachment 104370

This first one is a X-Y chart. And the bars you see are the error (only positive one).
You will need a helper table (rows 9 and 10)
For the Board and Division Manager text I added 2 textboxes grouped together.

Then there is simple bar chart:

View attachment 104371

Where you hide the bottom axis and use 30,4375 (days) in the major units.

Not the best options I think but maybe its a start?
They work both very good! Thank you! God bless you!
 
Upvote 0

Forum statistics

Threads
1,215,069
Messages
6,122,959
Members
449,096
Latest member
Anshu121

We've detected that you are using an adblocker.

We have a great community of people providing Excel help here, but the hosting costs are enormous. You can help keep this site running by allowing ads on MrExcel.com.
Allow Ads at MrExcel

Which adblocker are you using?

Disable AdBlock

Follow these easy steps to disable AdBlock

1)Click on the icon in the browser’s toolbar.
2)Click on the icon in the browser’s toolbar.
2)Click on the "Pause on this site" option.
Go back

Disable AdBlock Plus

Follow these easy steps to disable AdBlock Plus

1)Click on the icon in the browser’s toolbar.
2)Click on the toggle to disable it for "mrexcel.com".
Go back

Disable uBlock Origin

Follow these easy steps to disable uBlock Origin

1)Click on the icon in the browser’s toolbar.
2)Click on the "Power" button.
3)Click on the "Refresh" button.
Go back

Disable uBlock

Follow these easy steps to disable uBlock

1)Click on the icon in the browser’s toolbar.
2)Click on the "Power" button.
3)Click on the "Refresh" button.
Go back
Back
Top