Resource pyramid graph in Excel?

Tkr567

New Member
Joined
Feb 16, 2020
Messages
13
Office Version
  1. 365
Platform
  1. Windows
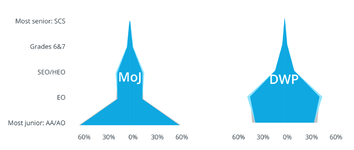
Anyone know if this sort of resource pyramid graph can be made in Excel and how we can make something similar?

(ignore the grey and different shades of blue - I'm more after the general concept of being able to represent %s in a pyramid)

The closest I could see was a funnel chart but curious if we can get the different grades connected like in this image.

Thanks!
 

Attachments

  • ResourcePyramidGraphs2.png
    ResourcePyramidGraphs2.png
    53.1 KB · Views: 12

Excel Facts

Can you sort left to right?
To sort left-to-right, use the Sort dialog box. Click Options. Choose "Sort left to right"
Hello
I think it is better to attach a sample file (without sensitive data) not a .png
Hello,
Mario
 
Upvote 0

Forum statistics

Threads
1,215,314
Messages
6,124,204
Members
449,147
Latest member
sweetkt327

We've detected that you are using an adblocker.

We have a great community of people providing Excel help here, but the hosting costs are enormous. You can help keep this site running by allowing ads on MrExcel.com.
Allow Ads at MrExcel

Which adblocker are you using?

Disable AdBlock

Follow these easy steps to disable AdBlock

1)Click on the icon in the browser’s toolbar.
2)Click on the icon in the browser’s toolbar.
2)Click on the "Pause on this site" option.
Go back

Disable AdBlock Plus

Follow these easy steps to disable AdBlock Plus

1)Click on the icon in the browser’s toolbar.
2)Click on the toggle to disable it for "mrexcel.com".
Go back

Disable uBlock Origin

Follow these easy steps to disable uBlock Origin

1)Click on the icon in the browser’s toolbar.
2)Click on the "Power" button.
3)Click on the "Refresh" button.
Go back

Disable uBlock

Follow these easy steps to disable uBlock

1)Click on the icon in the browser’s toolbar.
2)Click on the "Power" button.
3)Click on the "Refresh" button.
Go back
Back
Top