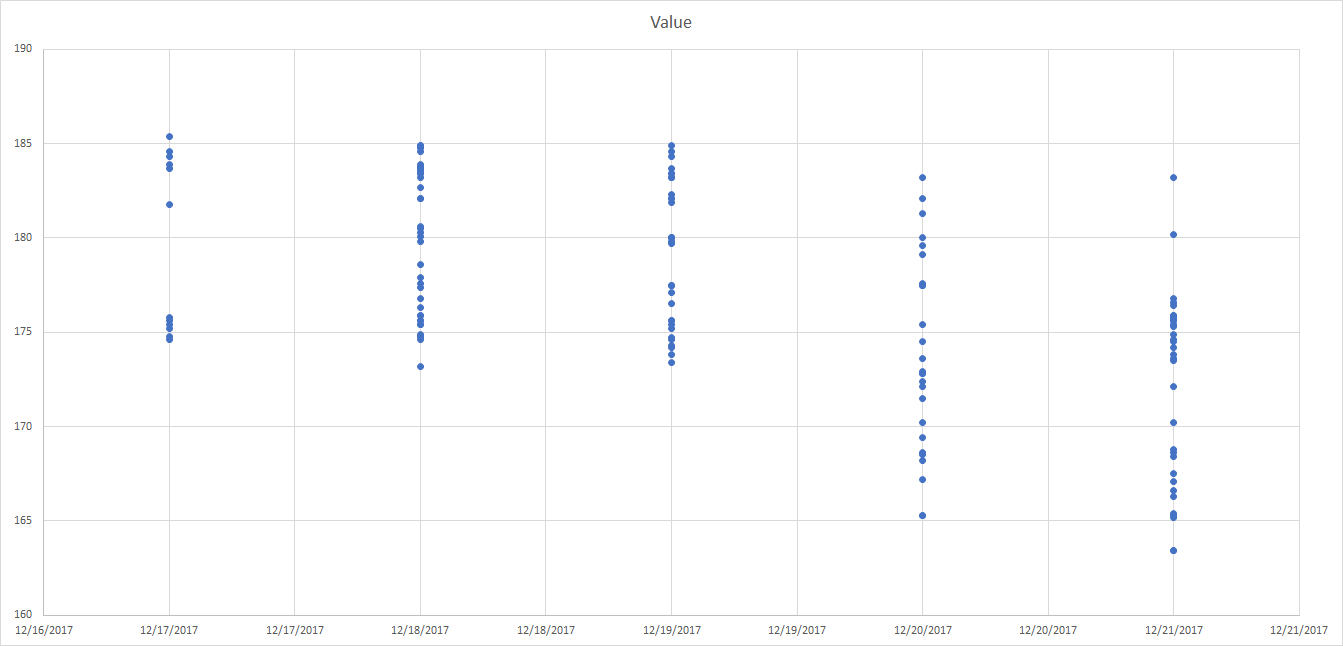
Hello all! I searched the forum for an answer to my question couldn't find an answer that worked for me but maybe I did not search properly. I am having a hard time creating a scatter chart that works for my data. Perhaps I should choose a different chart type but my boss has specifically requested a scatter chart. Maybe the issue is just in I have my data formatted? I feel like I am making this way more difficult than it is. I am new to this forum so if I have made any stupid mistakes please be kind in correcting me. haha Thank you!
<tbody>
</tbody>
| 12/17/17 | 12/18/17 | 12/19/17 | 12/20/17 | 12/21/17 |
| 174.6 | 175.6 | 181.9 | 174.5 | 176.4 |
| 174.8 | 177.4 | 182.3 | 172.1 | 175.8 |
| 175.2 | 177.9 | 183.4 | 165.3 | 175.9 |
| 184.3 | 180.3 | 174.2 | 175.4 | 173.8 |
| 184.6 | 183.5 | 173.4 | 177.5 | 174.2 |
| 185.4 | 179.8 | 175.6 | 180.0 | 173.6 |
| 175.4 | 175.4 | 173.8 | 177.6 | 175.6 |
| 175.6 | 177.6 | 174.6 | 182.1 | 175.7 |
| 175.8 | 180.1 | 174.7 | 183.2 | 175.9 |
| 181.8 | 178.6 | 177.5 | 168.5 | 174.6 |
| 183.7 | 182.1 | 182.1 | 165.3 | 174.5 |
| 183.9 | 183.4 | 183.2 | 167.2 | 175.3 |
| 182.1 | 183.7 | 170.2 | 174.9 | |
| 183.4 | 184.6 | 172.9 | 175.8 | |
| 183.2 | 184.9 | 172.8 | 176.6 | |
| 180.6 | 175.6 | 169.4 | 175.4 | |
| 182.7 | 174.3 | 168.6 | 172.1 | |
| 183.9 | 175.2 | 168.2 | 163.4 | |
| 174.8 | 180.0 | 172.4 | 167.5 | |
| 174.6 | 183.4 | 173.6 | 176.8 | |
| 175.4 | 183.2 | 172.8 | 166.3 | |
| 183.7 | 176.5 | 171.5 | 166.6 | |
| 183.6 | 177.1 | 14.2 | 165.4 | |
| 184.8 | 177.5 | 179.1 | 167.1 | |
| 174.9 | 180.0 | 177.5 | 168.8 | |
| 175.9 | 182.1 | 179.6 | 165.2 | |
| 176.8 | 184.3 | 181.3 | 175.6 | |
| 183.7 | 175.4 | 180.2 | ||
| 184.8 | 177.5 | 183.2 | ||
| 184.9 | 180.0 | 163.4 | ||
| 174.8 | 180.0 | 165.3 | ||
| 175.6 | 179.7 | 168.6 | ||
| 175.9 | 179.8 | 168.4 | ||
| 184.6 | 170.2 | |||
| 183.8 | 173.5 | |||
| 184.9 | ||||
| 173.2 | ||||
| 176.3 | ||||
| 180.5 |
<tbody>
</tbody>