Scattered graph - two different types of data markers

Svea

New Member
Joined
Aug 18, 2010
Messages
14
Hello friends,
I urgently need help on this one.
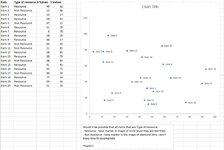
I need to make a scattered graph from the set of data and show labels next to the data. That I did without problems. Now I need to make sure that in some cases data markers are dots, in some cases data markers are diamonds (or any other symbol, doesn't really matter). I don't know how to solve it. Please, I have presentation tomorrow where this needs to work!
 

Excel Facts

Return population for a City
If you have a list of cities in A2:A100, use Data, Geography. Then =A2.Population and copy down.
Svea U need to provide more info. Is there more than 1 series? What markers need to be dots and what ones need to be diamonds. Also, is this an embedded chart on a sheet, if so what's the sheet name? Is it the only chart on a sheet and/or have U named it something other than "Chart1" for instance? Is a VBA solution OK? HTH. Dave
 
Upvote 0
Sure I do! I don't understand why my image didn't get uploaded. I will try again. I would highly appreciate help.
 

Attachments

  • question.jpg
    question.jpg
    232.1 KB · Views: 9
Upvote 0
OK seems to be just 1 series embedded on a sheet. I'm not sure if U can change the marker style for different points within the same series... I think probably not. But I think U could change the font colour of the data labels if this would suffice? Dave
 
Upvote 0
Trial a colour change to see if it works. Please backup your file before testing. Assuming that the chart is embedded on sheet1 and is named "chart1" and your type of resource is in "B"....
Code:
Sub test()
Dim cnt As Integer
For cnt = 1 To Sheets("Sheet1").ChartObjects(1).Chart.SeriesCollection(1).Points.Count
If Sheets("Sheet1").Range("B" & cnt + 1) = "Resource" Then
With Sheets("Sheet1").ChartObjects(1).Chart.SeriesCollection(1).Points(cnt).DataLabel
.Position = xlLabelPositionRight
.Orientation = xlHorizontal
.AutoScaleFont = True
.Font.ColorIndex = 3 'red
End With
Else
With Sheets("Sheet1").ChartObjects(1).Chart.SeriesCollection(1).Points(cnt).DataLabel
.Position = xlLabelPositionRight
.Orientation = xlHorizontal
.AutoScaleFont = True
.Font.ColorIndex = 5 'blue
End With
End If
Next cnt
End Sub
I think marker styles are applied to the whole series.... I'll check. Paste the code in sheet1 code and then run "test". HTH. Dave
 
Upvote 0
I found this quote...
"XlMarkerStyle enumeration (Excel) Specifies the marker style for a point or series in a line chart, scatter chart, or radar chart"
so U can trial this...
Code:
Sub test()
Dim cnt As Integer
For cnt = 1 To Sheets("Sheet1").ChartObjects(1).Chart.SeriesCollection(1).Points.Count
If Sheets("Sheet1").Range("B" & cnt + 1) = "Resource" Then
With Sheets("Sheet1").ChartObjects(1).Chart.SeriesCollection(1).Points(cnt)
.MarkerStyle = xlMarkerStyleDash
End With
Else
With Sheets("Sheet1").ChartObjects(1).Chart.SeriesCollection(1).Points(cnt)
.MarkerStyle = xlMarkerStyleDiamond
End With
End If
Next cnt
End Sub
Dave
 
Upvote 0
Thank you Dave, I will try that absolutely and get back did I manage to accomplish my diamonds and circles :)
By reading code it seems it could work. (y)
 
Upvote 0
Hello,
I have solved this problem by just dividing data in original table in more columns so I get more series. Now it works fine.
Dave, haven't tried your solution then. Thanks very much anyhow!

Br,
Ines
 
Upvote 0
Solution

Forum statistics

Threads
1,215,039
Messages
6,122,802
Members
449,095
Latest member
m_smith_solihull

We've detected that you are using an adblocker.

We have a great community of people providing Excel help here, but the hosting costs are enormous. You can help keep this site running by allowing ads on MrExcel.com.
Allow Ads at MrExcel

Which adblocker are you using?

Disable AdBlock

Follow these easy steps to disable AdBlock

1)Click on the icon in the browser’s toolbar.
2)Click on the icon in the browser’s toolbar.
2)Click on the "Pause on this site" option.
Go back

Disable AdBlock Plus

Follow these easy steps to disable AdBlock Plus

1)Click on the icon in the browser’s toolbar.
2)Click on the toggle to disable it for "mrexcel.com".
Go back

Disable uBlock Origin

Follow these easy steps to disable uBlock Origin

1)Click on the icon in the browser’s toolbar.
2)Click on the "Power" button.
3)Click on the "Refresh" button.
Go back

Disable uBlock

Follow these easy steps to disable uBlock

1)Click on the icon in the browser’s toolbar.
2)Click on the "Power" button.
3)Click on the "Refresh" button.
Go back
Back
Top