Excel_User_10k
Board Regular
- Joined
- Jun 25, 2022
- Messages
- 98
- Office Version
- 2021
- Platform
- Windows
Hello All,
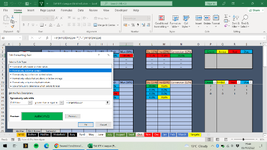
So basically there are several KPI's where the 'Target' Value can vary on a Month by Month basis. I would like to create several Conditional Formatting scenarios that highlights it as Green, Yellow, Red and Blue based on how close the ACTUAL figures are to said Target. At the moment I am having to change these ranges manually each Month if the Target changes. I have been able to do it for Green (i.e. when it =>"Target") but not the other three values.
To Illustrate:
Say the Target = 60%
The Cell showing the Current Actual Figure will have a Green background if it is =>60%
a Yellow background if it is between 50% - 59%
a Red background if it is between 30% -49% (Bare in mind that Red is actual default Cell Colour so doesn't technically need formatting but found it difficult to explain that)
and a Blue background if it is <30%
And then, say, the Target changed to 50%, I would like it to automatically reduce all of those Conditions by 10%. Is this possible, or am I asking too much?


