Suggestions for Complex Report Layout

mattyj7183

New Member
Joined
Dec 28, 2015
Messages
14
Office Version
  1. 365
Platform
  1. Windows
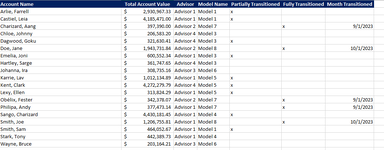
I was asked to keep track of a project and need to report on its progress every month. The raw data will be names, office locations, current model assignments, new model assignments, and the date the new model was reassigned. Initially, I was going to create monthly tables based on this data, but new names could be added/removed at any point, so using the same raw data tab as the source for this September's report and all future months wouldn't work.

I also thought of creating a report like I outlined above and saving it at the end of each month and using that as my month-end data. I'd then save as and start working on October's report. This could work, but the project may take months/years to complete, and there's no way to know I'll always be tasked with doing it.

Is there a better way to organize the data to accomplish what I want?

TIA!
 

Excel Facts

Pivot Table Drill Down
Double-click any number in a pivot table to create a new report showing all detail rows that make up that number
what version of excel do you use? Please update your profile so the version appears on your button.

I don't understand why you can't use one table/worksheet. If you're concerned with data not being needed for future reports use filters, and if necessary a filterable indicator that indicates if a line item should be included in the dashboard/reporting. Maybe add a removed indicator (and removed date) columns would be helpful.

Also, this does not seem too complex, maybe you can share some of the report/chart descriptions you will need to prepare. (The xl2bb add in (link below) is helpful with this).
 
Upvote 0
Thanks for the reply and suggestion to update my profile. I've been a member for 8 years and honestly didn't know it was there.

IT has us on lockdown, so I'll paste a pic of what I am talking about. Sorry


I would build monthly summary tables off this data, splitting them out by advisor and, within that, which model the person is assigned to. For simplicity, I would sum all people in models 1-6, but list 7 and 8 out individually.

The hang-up was twofold:

-The proper model assignment and the fully transitioned "x" denote if the person has been transitioned. For this, models 7 and 8 are the goals and can be considered transitioned, but the count would reflect who's assigned to 7 and who's assigned to 8. (see Charizard). Anyone not in 7 or 8 would be bucketed into one line item. Partially transitioned means nothing for report purposes.

-Although not long at 1020 rows, it can grow and shrink as people leave or new ones are added and I don't want to miss someone mistakenly. For example, I didn't want a person who transitioned in September but left in October to be missing from the September status report if I were to look at September numbers in November. This is why I was thinking of making a monthly report summary and having each month flow into a main summary sheet. Almost a summary of summaries, if you will. It's not a bad idea, but I felt as though there had to be a better way,

Any thoughts? Thanks again!
 

Attachments

  • Snip1.PNG
    Snip1.PNG
    39 KB · Views: 5
Upvote 0
I still don't understand what you're trying to accomplish.
Could you give sample of the 3 steps in your process.
Entering your data​
Creating the first summary​
Creating the summary of summaries.​
To me it still seems like you can put everything in one table, then build a pivot table and then export your pivot report data to another worksheet.
 
Upvote 0

Forum statistics

Threads
1,215,071
Messages
6,122,963
Members
449,094
Latest member
Anshu121

We've detected that you are using an adblocker.

We have a great community of people providing Excel help here, but the hosting costs are enormous. You can help keep this site running by allowing ads on MrExcel.com.
Allow Ads at MrExcel

Which adblocker are you using?

Disable AdBlock

Follow these easy steps to disable AdBlock

1)Click on the icon in the browser’s toolbar.
2)Click on the icon in the browser’s toolbar.
2)Click on the "Pause on this site" option.
Go back

Disable AdBlock Plus

Follow these easy steps to disable AdBlock Plus

1)Click on the icon in the browser’s toolbar.
2)Click on the toggle to disable it for "mrexcel.com".
Go back

Disable uBlock Origin

Follow these easy steps to disable uBlock Origin

1)Click on the icon in the browser’s toolbar.
2)Click on the "Power" button.
3)Click on the "Refresh" button.
Go back

Disable uBlock

Follow these easy steps to disable uBlock

1)Click on the icon in the browser’s toolbar.
2)Click on the "Power" button.
3)Click on the "Refresh" button.
Go back
Back
Top