I spent several hours trying to upload mini-sheet
Your data is too big for the mini sheet limitations. That's why I didn't suggest mini sheet.
")
If it was a different problem you had with using XL2BB then check out suggestions in
this thread.
I verified several blank spaces actual have data for those dates, so I don't know why they are blank.
Again, I am no expert on STOCKHISTORY but it doesn't work the way I think that you think it works. The data does not necessarily line up with the date headings you have at the top.
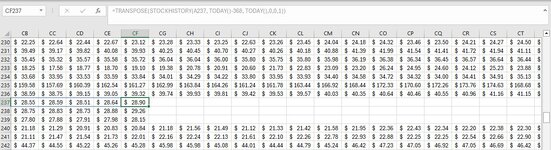
In your sample file, take row 91 as an example. If you look at the right hand value in that row, I think that you will find that closing value relates to the right hand date in row 1, which is not in the same column. The values that are missing are values from the
first columns (B, C, D, ..), not the last columns.
As I mentioned earlier, shorter rows would indicate that the stock does not have a full year of data history. Take the row 91 example again. When I look up stock TLST on XNAS and look at the Historical Data or the Chart, it shows data from Oct 2023 only, even though I have chosen a 1 year time frame at the top.
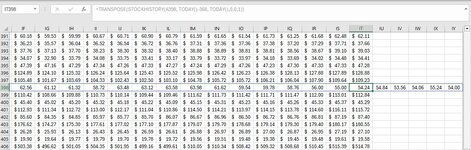
When you are at the end of the sheet cell IS, there are cells that are beyond and go to IW and some of those are in non USD. Why are they going beyond IS since I asked for only 368 days?
Because you are getting data from different markets and they will have a different number of holidays (& therefore a different number of trading days) in a year.
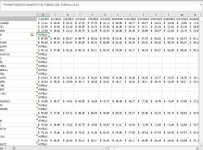
To get a better idea of what is happening, I suggest that you get a blank worksheet and experiment with some formulas like this that include the dates with each stock.
I have hidden some columns in this mini sheet and highlighted some cells to note.
My dates are in d/m/y format.
| Data123 Mr Excel Help .xlsx |
|---|
|
|---|
| A | B | C | D | | | | | | | | | | | | | | | | | | | | | Y | Z | AA | AB | AC |
|---|
| 1 | T-Rex 2X Long TESLA DT (XNAS:TSLT) | 19/10/2023 | 20/10/2023 | 23/10/2023 | | | | | | | | | | | | | | | | | | | | | 21/11/2023 | 22/11/2023 | 24/11/2023 | 27/11/2023 | 28/11/2023 |
|---|
| 2 | | $ 20.46 | $ 18.89 | $ 18.86 | | | | | | | | | | | | | | | | | | | | | $ 23.72 | $ 22.33 | $ 22.47 | $ 22.64 | $ 24.60 |
|---|
| 3 | | | | | | | | | | | | | | | | | | | | | | | | | | | | | |
|---|
| 4 | iShares:MBS ETF (XNAS:MBB) | 6/03/2023 | 7/03/2023 | 8/03/2023 | | | | | | | | | | | | | | | | | | | | | 6/04/2023 | 10/04/2023 | 11/04/2023 | 12/04/2023 | 13/04/2023 |
|---|
| 5 | | $ 92.30 | $ 92.07 | $ 92.05 | | | | | | | | | | | | | | | | | | | | | $ 95.49 | $ 94.56 | $ 94.90 | $ 95.12 | $ 95.06 |
|---|
| 6 | | | | | | | | | | | | | | | | | | | | | | | | | | | | | |
|---|
| 7 | LS ARKW TRACKER ETP (XLON:ARKB) | 6/03/2023 | 7/03/2023 | 8/03/2023 | | | | | | | | | | | | | | | | | | | | | 6/04/2023 | 11/04/2023 | 12/04/2023 | 13/04/2023 | 14/04/2023 |
|---|
| 8 | | 176.95 | 174.50 | 174.75 | | | | | | | | | | | | | | | | | | | | | 166.45 | 170.10 | 167.75 | 170.30 | 169.00 |
|---|
|
|---|