Use data from cells of one worksheet table to determine table & column selection in a different worksheet.

Worksong

New Member
Joined
Mar 23, 2024
Messages
16
Office Version
  1. 365
Platform
  1. Windows
Hello all! I'm not sure what I'm after can be done, but figured I'd ask anyway. I'm setting up a spreadsheet to score a 66-question assessment that rates 8 categories of data.
The raw score for each category corresponds with a T-score (kind of like a percentile) that is adjusted for age range and gender. The paper version has two very large tables, one each for male and female respondents, that has 8 columns (one for each category), each of which has 4 sub-columns (one for each age range). To score, one picks the appropriate respondent gender table, category, and column for the respondent's age, and then finds the correct T-score for the raw score. With me so far?

In my spreadsheet so far, there are cells to enter the respondent's age and gender.
1715269131082.png


The spreadsheet takes the 66 answers and calculates a raw score for each of the 8 categories and puts it in one of two tables, one for male respondents and one for female respondents. Each table has four columns that represent age ranges.

1715269237852.png


I set up separate tabs for male and female respondents, and each tab has a table for each age range. See screenshots below:

1715269373804.png


1715269312055.png


I want the spreadsheet to use the age, gender and raw score cells for each category to select the correct tab, table and column, match the raw score to the appropriate T-score, and populate the T-score in the appropriate cell of the raw score tables of the main spreadsheet. Still with me?

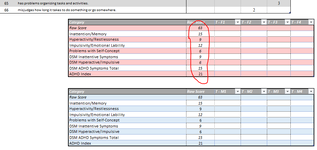
For a 34 year-old female respondent, I want the spreadsheet to select these raw scores:
1715269866442.png

Select this tab:
1715269925978.png


This table:
1715270061220.png


And then use each category's raw score to select the corresponding T-score and return it to the main spreadsheet:

1715270313148.png

If Excel can in fact do something like this, any help is appreciated. Thank you!!
 

Attachments

  • 1715269825076.png
    1715269825076.png
    42.4 KB · Views: 3

Excel Facts

What is the last column in Excel?
Excel columns run from A to Z, AA to AZ, AAA to XFD. The last column is XFD.
Sounds like you want a dynamic table reference. How do you have the tables named? If you have consistently named tables for those T scores, I think you could use INDIRECT to create a table reference. For example, if you name your tables "[gender]_[age range]", then I think that makes this a lot easier.

INDIRECT is a volatile function that can affect performance, but in this case I think it's either that or figuring out how to combine all your T scores into one big table.
 
Last edited:
Upvote 0
Sounds like you want a dynamic table reference. How do you have the tables named? If you have consistently named tables for those T scores, I think you could use INDIRECT to create a table reference. For example, if you name your tables "[gender]_[age range]", then I think that makes this a lot easier.

INDIRECT is a volatile function that can affect performance, but in this case I think it's either that or figuring out how to combine all your T scores into one big table.
Thanks Vogateer. Er, I wasn't aware that I can choose table names! It wouldn't be very difficult to make one large table - sounds like that's the simplest option?
 
Upvote 0
Yes, making one large table should be the simplest option. I think you could use VSTACK or some other feature to combine all the tables into one big table, then you should be in good shape to reference it. You might need an identifier column so you can select the values you want, but once that's in place, you're in great shape for this.
 
Upvote 0
Can you explain where all of the data comes from in the first place before the separated tabs are populated?

Is this a one off exercise or does it need to be repeated over time?
 
Upvote 0
Can you explain where all of the data comes from in the first place before the separated tabs are populated?

Is this a one off exercise or does it need to be repeated over time?
Hello HighAndWilder,
Yes - the data is entered by hand, transcribed from paper or PDF. It's a one-off thing - it's a behavior report filled out by an outside observer of a client being evaluated for ADHD. Usually it's filled out by the client's partner, close friend, or parent/close family member. The scoring protocol assesses how consistent the observed behaviors are with adult ADHD, adjusted for the age and gender of the client being evaluated. The assessment is only done once, during the initial evaluation. Does that all make sense?
 
Upvote 0
Leaving any analysis aside for now, the first task is to design the structure of the table into which ALL of the raw data is to be deposited.
Use meaningful column headings and only have one heading row. If multiple tabs or header rows were deemed necessary to describe what the data represents then separate columns will be needed to contain the identifying data.

When designing data structures, one should be aiming for a long thin table and not a short fat one. This will make any subsequent analysis easier and more straight forward.

This does not need to be converted to a table until all of the data has been copied into the same sheet.
It may be easier if it isn't.

When you combine data from different tables you will need columns with repeating data that identifies what the
data represents. In your case, for example and not conclusive, a column for Gender (containing M.F etc) and a column for
Age Range (containing the age range)

Can you use XL2BB to submit some representative data as it was transcribed from paper or PDF. Doing this will mean that
I can create a worksheet out of it. I cannot take data from an image.

Once the entered data is all in one table then we can look at the analysis. Some of the original questions about identifying
which table the data comes from will then be irrelevant.
Hi HighAndWilder, I was able to quickly create one table, just by the nature of the data it's a bit on the "longer and thinner" side - 65 rows / 73 columns.
1715797791650.png


Here's a close-up of column headers:
1715797980055.png
 
Upvote 0
Hi HighAndWilder, I was able to quickly create one table, just by the nature of the data it's a bit on the "longer and thinner" side - 65 rows / 73 columns.
View attachment 111452

Here's a close-up of column headers:
View attachment 111453


Hi HighAndWilder, I was able to quickly create one table, just by the nature of the data it's a bit on the "longer and thinner" side - 65 rows / 73 columns.
View attachment 111452

Here's a close-up of column headers:
View attachment 111453

Please read this page from the link below:
XL2BB

XL2BB captures the cells in the selected range and converts it to a special BB code hash that you can paste into a post. The resulting mini-sheet can be copied and pasted back to an Excel worksheet with formulas and formatting that provides a simple way to exchange sample range between the post and Excel application.

Use the XL2BB download and install option on the right hand side of the Mr Excel editor ribbon.

Once you have installed it post the data (63 * 75 columns) using it or come back for more help.
 
Upvote 0

Forum statistics

Threads
1,216,127
Messages
6,129,022
Members
449,481
Latest member
joaotcosta23

We've detected that you are using an adblocker.

We have a great community of people providing Excel help here, but the hosting costs are enormous. You can help keep this site running by allowing ads on MrExcel.com.
Allow Ads at MrExcel

Which adblocker are you using?

Disable AdBlock

Follow these easy steps to disable AdBlock

1)Click on the icon in the browser’s toolbar.
2)Click on the icon in the browser’s toolbar.
2)Click on the "Pause on this site" option.
Go back

Disable AdBlock Plus

Follow these easy steps to disable AdBlock Plus

1)Click on the icon in the browser’s toolbar.
2)Click on the toggle to disable it for "mrexcel.com".
Go back

Disable uBlock Origin

Follow these easy steps to disable uBlock Origin

1)Click on the icon in the browser’s toolbar.
2)Click on the "Power" button.
3)Click on the "Refresh" button.
Go back

Disable uBlock

Follow these easy steps to disable uBlock

1)Click on the icon in the browser’s toolbar.
2)Click on the "Power" button.
3)Click on the "Refresh" button.
Go back
Back
Top