Use data from cells of one worksheet table to determine table & column selection in a different worksheet.

Worksong

New Member
Joined
Mar 23, 2024
Messages
18
Office Version
  1. 365
Platform
  1. Windows
Hello all! I'm not sure what I'm after can be done, but figured I'd ask anyway. I'm setting up a spreadsheet to score a 66-question assessment that rates 8 categories of data.
The raw score for each category corresponds with a T-score (kind of like a percentile) that is adjusted for age range and gender. The paper version has two very large tables, one each for male and female respondents, that has 8 columns (one for each category), each of which has 4 sub-columns (one for each age range). To score, one picks the appropriate respondent gender table, category, and column for the respondent's age, and then finds the correct T-score for the raw score. With me so far?

In my spreadsheet so far, there are cells to enter the respondent's age and gender.
1715269131082.png


The spreadsheet takes the 66 answers and calculates a raw score for each of the 8 categories and puts it in one of two tables, one for male respondents and one for female respondents. Each table has four columns that represent age ranges.

1715269237852.png


I set up separate tabs for male and female respondents, and each tab has a table for each age range. See screenshots below:

1715269373804.png


1715269312055.png


I want the spreadsheet to use the age, gender and raw score cells for each category to select the correct tab, table and column, match the raw score to the appropriate T-score, and populate the T-score in the appropriate cell of the raw score tables of the main spreadsheet. Still with me?

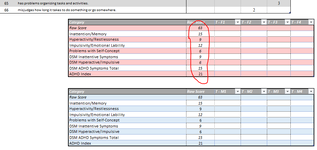
For a 34 year-old female respondent, I want the spreadsheet to select these raw scores:
1715269866442.png

Select this tab:
1715269925978.png


This table:
1715270061220.png


And then use each category's raw score to select the corresponding T-score and return it to the main spreadsheet:

1715270313148.png

If Excel can in fact do something like this, any help is appreciated. Thank you!!
 

Attachments

  • 1715269825076.png
    1715269825076.png
    42.4 KB · Views: 7

Excel Facts

Does the VLOOKUP table have to be sorted?
No! when you are using an exact match, the VLOOKUP table can be in any order. Best-selling items at the top is actually the best.
Sounds like you want a dynamic table reference. How do you have the tables named? If you have consistently named tables for those T scores, I think you could use INDIRECT to create a table reference. For example, if you name your tables "[gender]_[age range]", then I think that makes this a lot easier.

INDIRECT is a volatile function that can affect performance, but in this case I think it's either that or figuring out how to combine all your T scores into one big table.
 
Last edited:
Upvote 0
Sounds like you want a dynamic table reference. How do you have the tables named? If you have consistently named tables for those T scores, I think you could use INDIRECT to create a table reference. For example, if you name your tables "[gender]_[age range]", then I think that makes this a lot easier.

INDIRECT is a volatile function that can affect performance, but in this case I think it's either that or figuring out how to combine all your T scores into one big table.
Thanks Vogateer. Er, I wasn't aware that I can choose table names! It wouldn't be very difficult to make one large table - sounds like that's the simplest option?
 
Upvote 0
Yes, making one large table should be the simplest option. I think you could use VSTACK or some other feature to combine all the tables into one big table, then you should be in good shape to reference it. You might need an identifier column so you can select the values you want, but once that's in place, you're in great shape for this.
 
Upvote 0
Can you explain where all of the data comes from in the first place before the separated tabs are populated?

Is this a one off exercise or does it need to be repeated over time?
 
Upvote 0
Can you explain where all of the data comes from in the first place before the separated tabs are populated?

Is this a one off exercise or does it need to be repeated over time?
Hello HighAndWilder,
Yes - the data is entered by hand, transcribed from paper or PDF. It's a one-off thing - it's a behavior report filled out by an outside observer of a client being evaluated for ADHD. Usually it's filled out by the client's partner, close friend, or parent/close family member. The scoring protocol assesses how consistent the observed behaviors are with adult ADHD, adjusted for the age and gender of the client being evaluated. The assessment is only done once, during the initial evaluation. Does that all make sense?
 
Upvote 0
Leaving any analysis aside for now, the first task is to design the structure of the table into which ALL of the raw data is to be deposited.
Use meaningful column headings and only have one heading row. If multiple tabs or header rows were deemed necessary to describe what the data represents then separate columns will be needed to contain the identifying data.

When designing data structures, one should be aiming for a long thin table and not a short fat one. This will make any subsequent analysis easier and more straight forward.

This does not need to be converted to a table until all of the data has been copied into the same sheet.
It may be easier if it isn't.

When you combine data from different tables you will need columns with repeating data that identifies what the
data represents. In your case, for example and not conclusive, a column for Gender (containing M.F etc) and a column for
Age Range (containing the age range)

Can you use XL2BB to submit some representative data as it was transcribed from paper or PDF. Doing this will mean that
I can create a worksheet out of it. I cannot take data from an image.

Once the entered data is all in one table then we can look at the analysis. Some of the original questions about identifying
which table the data comes from will then be irrelevant.
Hi HighAndWilder, I was able to quickly create one table, just by the nature of the data it's a bit on the "longer and thinner" side - 65 rows / 73 columns.
1715797791650.png


Here's a close-up of column headers:
1715797980055.png
 
Upvote 0
Hi HighAndWilder, I was able to quickly create one table, just by the nature of the data it's a bit on the "longer and thinner" side - 65 rows / 73 columns.
View attachment 111452

Here's a close-up of column headers:
View attachment 111453


Hi HighAndWilder, I was able to quickly create one table, just by the nature of the data it's a bit on the "longer and thinner" side - 65 rows / 73 columns.
View attachment 111452

Here's a close-up of column headers:
View attachment 111453

Please read this page from the link below:
XL2BB

XL2BB captures the cells in the selected range and converts it to a special BB code hash that you can paste into a post. The resulting mini-sheet can be copied and pasted back to an Excel worksheet with formulas and formatting that provides a simple way to exchange sample range between the post and Excel application.

Use the XL2BB download and install option on the right hand side of the Mr Excel editor ribbon.

Once you have installed it post the data (63 * 75 columns) using it or come back for more help.
 
Upvote 0
Please read this page from the link below:
XL2BB

XL2BB captures the cells in the selected range and converts it to a special BB code hash that you can paste into a post. The resulting mini-sheet can be copied and pasted back to an Excel worksheet with formulas and formatting that provides a simple way to exchange sample range between the post and Excel application.

Use the XL2BB download and install option on the right hand side of the Mr Excel editor ribbon.

Once you have installed it post the data (63 * 75 columns) using it or come back for more help.
Hi again, the data set was too big for one MiniTable (apparently 3000 cells is the limit and the table has about 4300), so I grabbed it in two pieces.
CAARS-O.L T Score Table Scoring Spreadsheet Draft 051524.xlsm
BCDEFGHIJKLMNOPQRSTUVWXYZAAABACADAEAFAGAH
4TF1 18-29F2 30-39F3 40-49F4 50 and Older
5T1F1AF1BF1CF1DF1EF1FF1GF1HF2AF2BF2CF2DF2EF2FF2GF2HF3AF3BF3CF3DF3EF3FF3GF3HF4AF4BF4CF4DF4EF4FF4GF4H
6F1 - 18-29F2 - 30-39F3 - 40-49F4 - 50 and older
7902751+33+32+2751+33+31+362725+47+31+32+2725+47+31+
889265032265032303526244626244630
9883649314945303145
10872548313025483129342523252329
118635474730283344293036364428
12853436272446302927244624224328293535242243
138433454529273242344227
1483352623442928363626234431232141272834232141
15823234254328273535254328263640273333184026
1681313622422242273035222039263232222039
178033244127263434244125293418382526313825
18793032351821403333182140262433211931172119
1978293134232625323223281737242530303724
20773320392420392523273220183624292916201836
2176283017223825313117223824313523283523
227527293219372423303019372226301619173423281519173422
23742631162136292916213623253322272733
24732830183523222828183521291518163221222618163221
25722527291520342115203422202428312126251431
2671241733222727173323271417152025171520
2770262819322026261932211926302024241330
286923252714181631212525141816312022161429192316142919
2968222426302019301821251328192328
306725131715291824241317152919172415271818222212152718
31662123281923232820231214132617212114132617
3265202224121627172222121627181619222517201125
3364192314182121141713122416162013122416
34632122152616152615182111191910
3562182011132517152020111325161417201211231515181812112315
3661172114241619191424191022141722
37601920101223141818101223151316181110211417911102114
3859161819132215132214159201313161620
395815171891121131717911211217109191581091913
40571412201412161612201311141618121215141812
41561617101913151581019131589814798
42551315168111811141118121017111113131711
43541215109171210147109171112147816101012816
44531414716131316911137151211671510
4552111398151191212981510127149911714
465110136141111614810116613101056139
475091212871081087979612889612
4849911115139710513105511779845118
494881076129976128689585
504771011868841177844106674107
5146699465107651057495763496
52456889757396463856538
534457354846654856337452375
54434776557535226434226
5542466243653424364442153431154
564135543152331423214
57402541324423324310321210033
583943131220131220211002
59381302023112022011010012
60370211000111000001
6136210020000
623510010
633400
6433
6532
6631
6730
CAARS-OL T scores Table
 
Upvote 0

Forum statistics

Threads
1,216,765
Messages
6,132,593
Members
449,737
Latest member
naes

We've detected that you are using an adblocker.

We have a great community of people providing Excel help here, but the hosting costs are enormous. You can help keep this site running by allowing ads on MrExcel.com.
Allow Ads at MrExcel

Which adblocker are you using?

Disable AdBlock

Follow these easy steps to disable AdBlock

1)Click on the icon in the browser’s toolbar.
2)Click on the icon in the browser’s toolbar.
2)Click on the "Pause on this site" option.
Go back

Disable AdBlock Plus

Follow these easy steps to disable AdBlock Plus

1)Click on the icon in the browser’s toolbar.
2)Click on the toggle to disable it for "mrexcel.com".
Go back

Disable uBlock Origin

Follow these easy steps to disable uBlock Origin

1)Click on the icon in the browser’s toolbar.
2)Click on the "Power" button.
3)Click on the "Refresh" button.
Go back

Disable uBlock

Follow these easy steps to disable uBlock

1)Click on the icon in the browser’s toolbar.
2)Click on the "Power" button.
3)Click on the "Refresh" button.
Go back
Back
Top