Hi Everybody, first time to mrexcel. I had a question with a spreadsheet Im constructing.
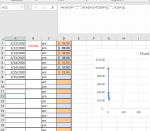
I want to make a chart that changes everyday. I have inputs that are produced 2x daily. What I would like is a chart to display a price change over time without stretching the entire chart out.
Additionally I have added a condition on my dates column to clear any dates that are not after TODAY() by setting it to " " (this is to make it easier for me to input data).
My expectation is that excel should read the dates and the prices and graph them appropriately. However, it seems to mess up the x-axis. Alternatively, if I kept my dates displayed (bypassing the IF(x>TODAY()) ) then it displays a chart for the whole year, which defeats what I want the graph to do. That being, display the data x-axis to todays date.
Note: The Column with Sunday is just a marker of the start of the week, it has no interaction with the data set or the graph.
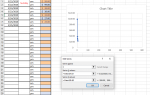