Hi all,
I am currently working on this heatmap work sheet, which is project management related. Coming from a shaky Excel background, I do hope that people here can enlighten me on:
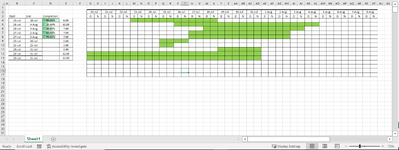
1. The user will input the starting date and the finish date of the project in column I and J respectively and based on the number of days, I need to automate the trigger of the boxes accordingly as shown in the picture. (Eg: If project start = 5 Aug, project end = 7 Aug, how can I trigger 3 columns of borders?)
2. Colouring the boxes triggered in (1) accordingly.
Thanks everyone in advance (
(

I am currently working on this heatmap work sheet, which is project management related. Coming from a shaky Excel background, I do hope that people here can enlighten me on:
1. The user will input the starting date and the finish date of the project in column I and J respectively and based on the number of days, I need to automate the trigger of the boxes accordingly as shown in the picture. (Eg: If project start = 5 Aug, project end = 7 Aug, how can I trigger 3 columns of borders?)
2. Colouring the boxes triggered in (1) accordingly.
Thanks everyone in advance
(