carting time intervals on x axis

PHIL.Pearce84

Board Regular
Joined
May 16, 2011
Messages
152
Office Version
  1. 365
Platform
  1. Windows
Hi,

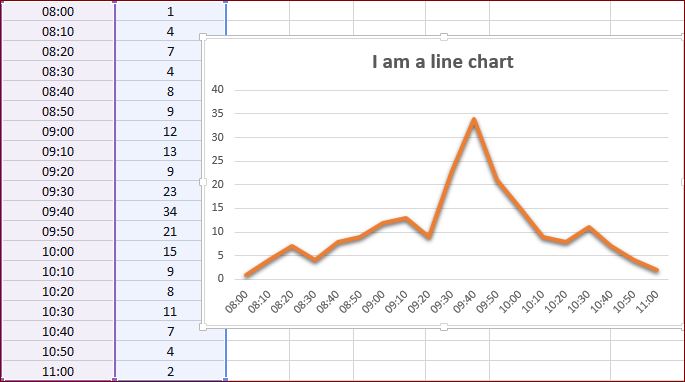
I have a chart that I need to display 08:00 to 17:30 in 10 min intervals, the source data for the x axis is in this format but I can't get it to replicate on the chart?

Any help would be appreicated
 

Excel Facts

Can you AutoAverage in Excel?
There is a drop-down next to the AutoSum symbol. Open the drop-down to choose AVERAGE, COUNT, MAX, or MIN
Hi

ws8BjTu.jpg
 
Upvote 0

Forum statistics

Threads
1,215,400
Messages
6,124,702
Members
449,180
Latest member
craigus51286

We've detected that you are using an adblocker.

We have a great community of people providing Excel help here, but the hosting costs are enormous. You can help keep this site running by allowing ads on MrExcel.com.
Allow Ads at MrExcel

Which adblocker are you using?

Disable AdBlock

Follow these easy steps to disable AdBlock

1)Click on the icon in the browser’s toolbar.
2)Click on the icon in the browser’s toolbar.
2)Click on the "Pause on this site" option.
Go back

Disable AdBlock Plus

Follow these easy steps to disable AdBlock Plus

1)Click on the icon in the browser’s toolbar.
2)Click on the toggle to disable it for "mrexcel.com".
Go back

Disable uBlock Origin

Follow these easy steps to disable uBlock Origin

1)Click on the icon in the browser’s toolbar.
2)Click on the "Power" button.
3)Click on the "Refresh" button.
Go back

Disable uBlock

Follow these easy steps to disable uBlock

1)Click on the icon in the browser’s toolbar.
2)Click on the "Power" button.
3)Click on the "Refresh" button.
Go back
Back
Top