Hi All,
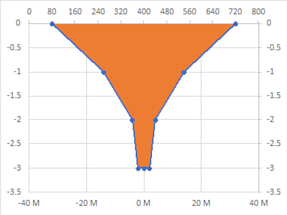
I attempted to post an attachment, but it appears I do not have this permission? I am attempting to fill the are under my XY scatter plot, but for some reason the area chart and XY scatter plot are just slightly misaligned along the X Axis. If anyone is willing to attempt to recreate this to help me troubleshoot, here is the initial guidance I am following:
https://peltiertech.com/fill-under-between-series-in-excel-chart/
<colgroup><col><col><col><col></colgroup><tbody>
</tbody>
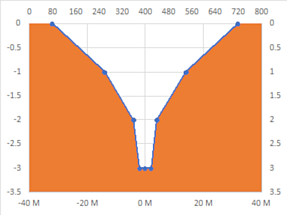
I attempted to post an attachment, but it appears I do not have this permission? I am attempting to fill the are under my XY scatter plot, but for some reason the area chart and XY scatter plot are just slightly misaligned along the X Axis. If anyone is willing to attempt to recreate this to help me troubleshoot, here is the initial guidance I am following:
https://peltiertech.com/fill-under-between-series-in-excel-chart/
| Area Chart | |||
| X Value | Y Value | ||
| Scatter Plot | -1,000.00 | 0.00 | |
| X Value | Y Value | -914.29 | 0.00 |
| -32,000,000.00 | 0.00 | -914.29 | 0.00 |
| -14,000,000.00 | -1.00 | -400.00 | -1.00 |
| -4,000,000.00 | -2.00 | -114.29 | -2.00 |
| -2,000,000.00 | -3.00 | -57.14 | -3.00 |
| 0.00 | -3.00 | 0.00 | -3.00 |
| 0.00 | -3.00 | 0.00 | -3.00 |
| 2,000,000.00 | -3.00 | 57.14 | -3.00 |
| 4,000,000.00 | -2.00 | 114.29 | -2.00 |
| 14,000,000.00 | -1.00 | 400.00 | -1.00 |
| 32,000,000.00 | 0.00 | 914.29 | 0.00 |
| 914.29 | 0.00 | ||
| 1,000.00 | 0.00 | ||
| -3.50 | Y min | ||
| 0.00 | Y max |
<colgroup><col><col><col><col></colgroup><tbody>
</tbody>